DEMO_MixedTetHexMeshing_torus
Below is a demonstration of how to create a mixed mesh consisting of (linear) hexahedral and tetrahedral elements. The hexahedral mesh is regular while the tetrahedral mesh is derived using TetGen.
Contents
clear; close all; clc;
Plot settings for the examples below
fontSize=20;
faceAlpha1=1;
faceAlpha2=0.3;
edgeColor=0.3*ones(1,3);
edgeWidth=1;
searchRadius=6;
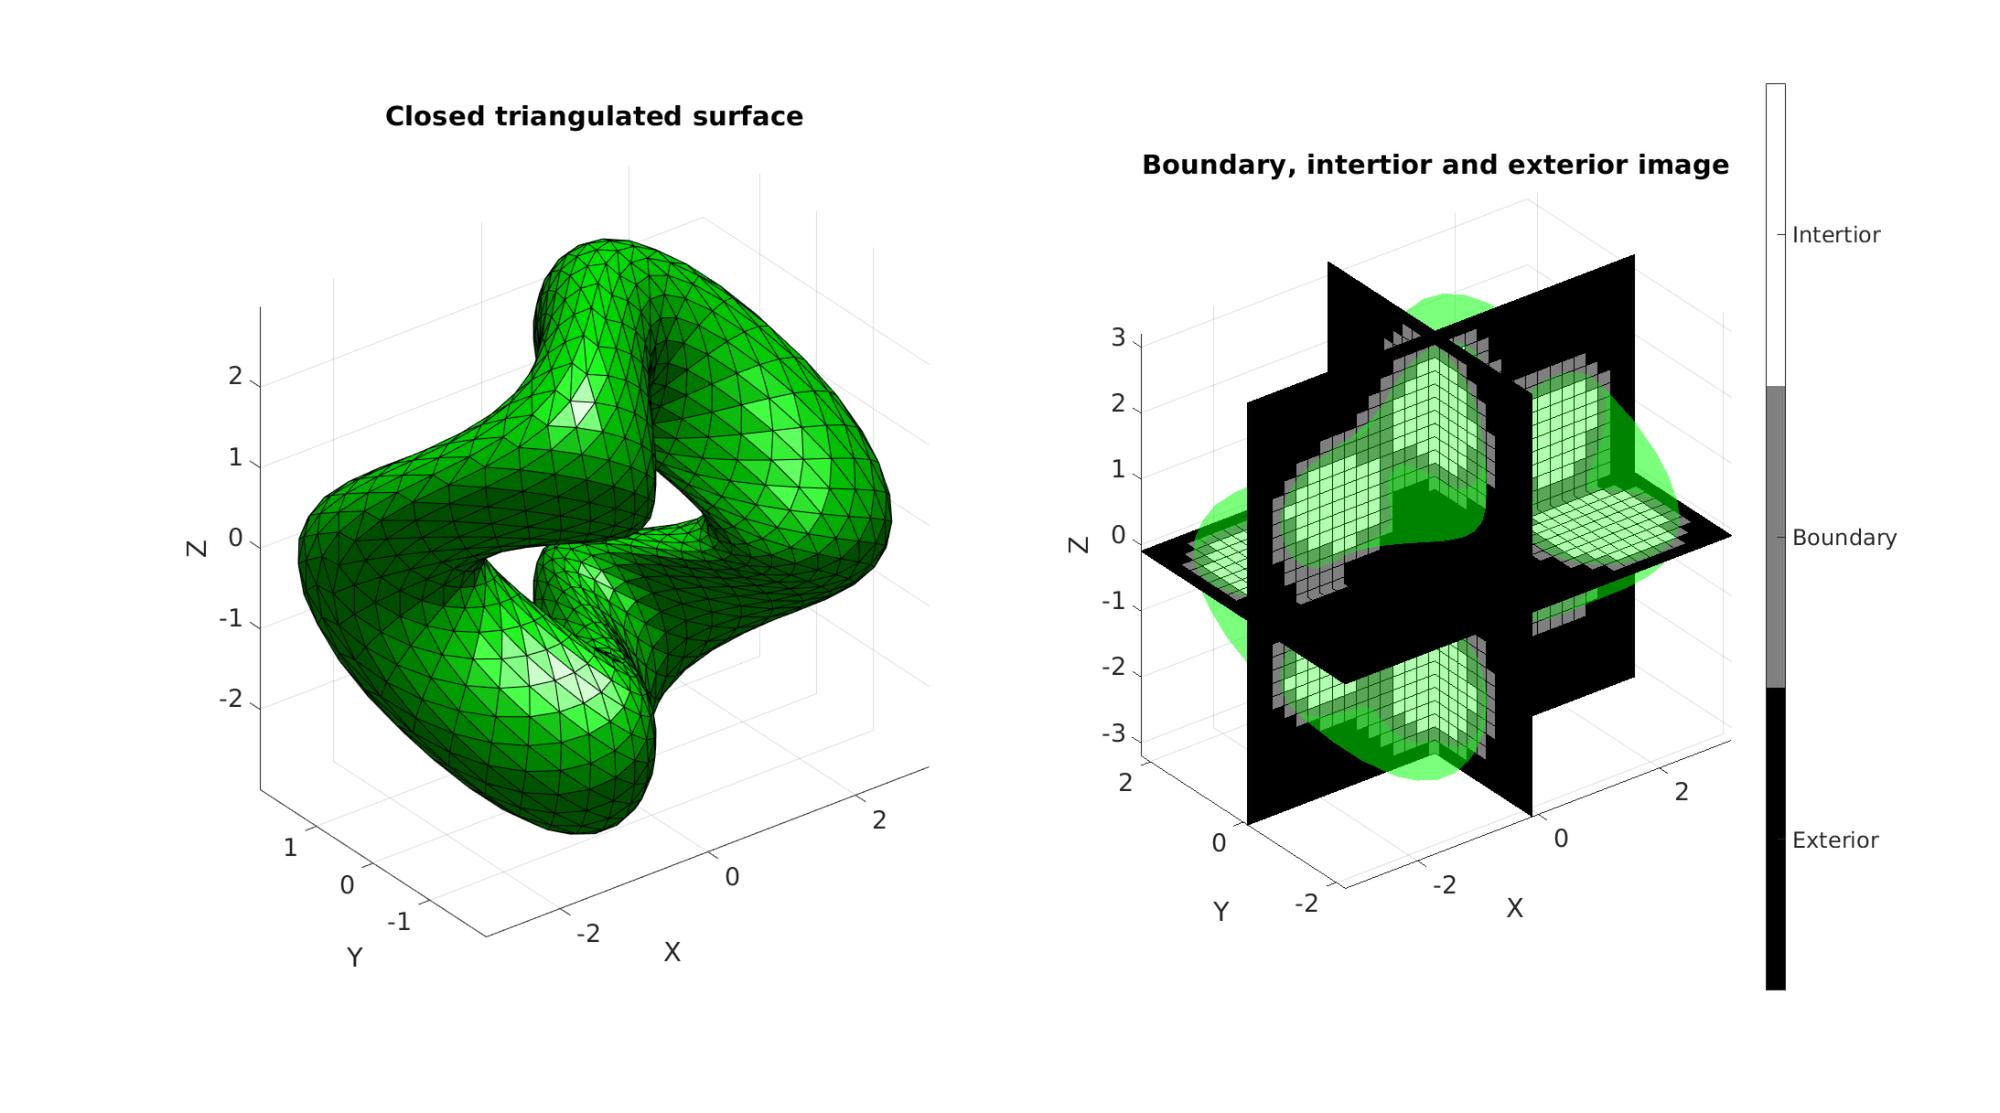
CONVERTING A TRIANGULATED SURFACE TO AN IMAGE WITH DESIRED SIZE, VOXEL SIZE AND ORIGIN
Defining an example triangulated surface model
% Defining a deformed and rotated torus shape
r=1; %Sphere radius
rc=2; %Central radius
nr=25;
nc=50;
ptype='tri';
[Fs,Vs]=patchTorus(r,nr,rc,nc,ptype);
[THETA,RHO] = cart2pol(Vs(:,1),Vs(:,2));
Vs(:,3)=Vs(:,3)+sin(3*THETA);
[R,~]=euler2DCM([0.5*pi 0.5*pi 0.*pi]);
Vs=Vs*R;
Setting control parameters
% Defining the full set of possible control parameters
voxelSize=0.2; % The output image voxel size.
imOrigin=min(Vs,[],1)-voxelSize;
imMax=max(Vs,[],1)+voxelSize;
imSiz=round((imMax-imOrigin)/voxelSize);
imSiz=imSiz([2 1 3]); %Image size (x, y corresponds to j,i in image coordinates, hence the permutation)

% Using |triSurf2Im| function to convert patch data to image data
[M,~]=triSurf2Im(Fs,Vs,voxelSize,imOrigin,imSiz);
Plotting the results
hf1=cFigure;
subplot(1,2,1);
title('Closed triangulated surface','FontSize',fontSize);
xlabel('X','FontSize',fontSize);ylabel('Y','FontSize',fontSize); zlabel('Z','FontSize',fontSize);
hold on;
patch('Faces',Fs,'Vertices',Vs,'FaceColor','g','EdgeColor','k','FaceAlpha',faceAlpha1);
camlight('headlight'); lighting flat;
axis equal; view(3); axis tight;  grid on;  set(gca,'FontSize',fontSize);

subplot(1,2,2);
title('Boundary, intertior and exterior image','FontSize',fontSize);
xlabel('X','FontSize',fontSize);ylabel('Y','FontSize',fontSize); zlabel('Z','FontSize',fontSize);
hold on;

patch('Faces',Fs,'Vertices',Vs,'FaceColor','g','EdgeColor','none','FaceAlpha',faceAlpha2);
L_plot=false(size(M));
L_plot(:,:,round(size(M,3)/2))=1;
[Fm,Vm,Cm]=ind2patch(L_plot,double(M),'sk');
[Vm(:,1),Vm(:,2),Vm(:,3)]=im2cart(Vm(:,2),Vm(:,1),Vm(:,3),voxelSize*ones(1,3));
Vm=Vm+imOrigin(ones(size(Vm,1),1),:);
patch('Faces',Fm,'Vertices',Vm,'FaceColor','flat','CData',Cm,'EdgeColor','k','FaceAlpha',faceAlpha1);

L_plot=false(size(M));L_plot(round(size(M,1)/2),:,:)=1;
[Fm,Vm,Cm]=ind2patch(L_plot,M,'si');
[Vm(:,1),Vm(:,2),Vm(:,3)]=im2cart(Vm(:,2),Vm(:,1),Vm(:,3),voxelSize*ones(1,3));
Vm=Vm+imOrigin(ones(size(Vm,1),1),:);
patch('Faces',Fm,'Vertices',Vm,'FaceColor','flat','CData',Cm,'EdgeColor','k','FaceAlpha',faceAlpha1);

L_plot=false(size(M));L_plot(:,round(size(M,2)/2),:)=1;
[Fm,Vm,Cm]=ind2patch(L_plot,M,'sj');
[Vm(:,1),Vm(:,2),Vm(:,3)]=im2cart(Vm(:,2),Vm(:,1),Vm(:,3),voxelSize*ones(1,3));
Vm=Vm+imOrigin(ones(size(Vm,1),1),:);
patch('Faces',Fm,'Vertices',Vm,'FaceColor','flat','CData',Cm,'EdgeColor','k','FaceAlpha',faceAlpha1);

colormap(gray(3)); caxis([0 2]);
hc=colorbar;
set(hc,'YTick',[1/3 1 5/3]);
set(hc,'YTickLabel',{'Exterior','Boundary','Intertior'});
axis equal; view(3); axis tight;  grid on;  set(gca,'FontSize',fontSize);
drawnow;
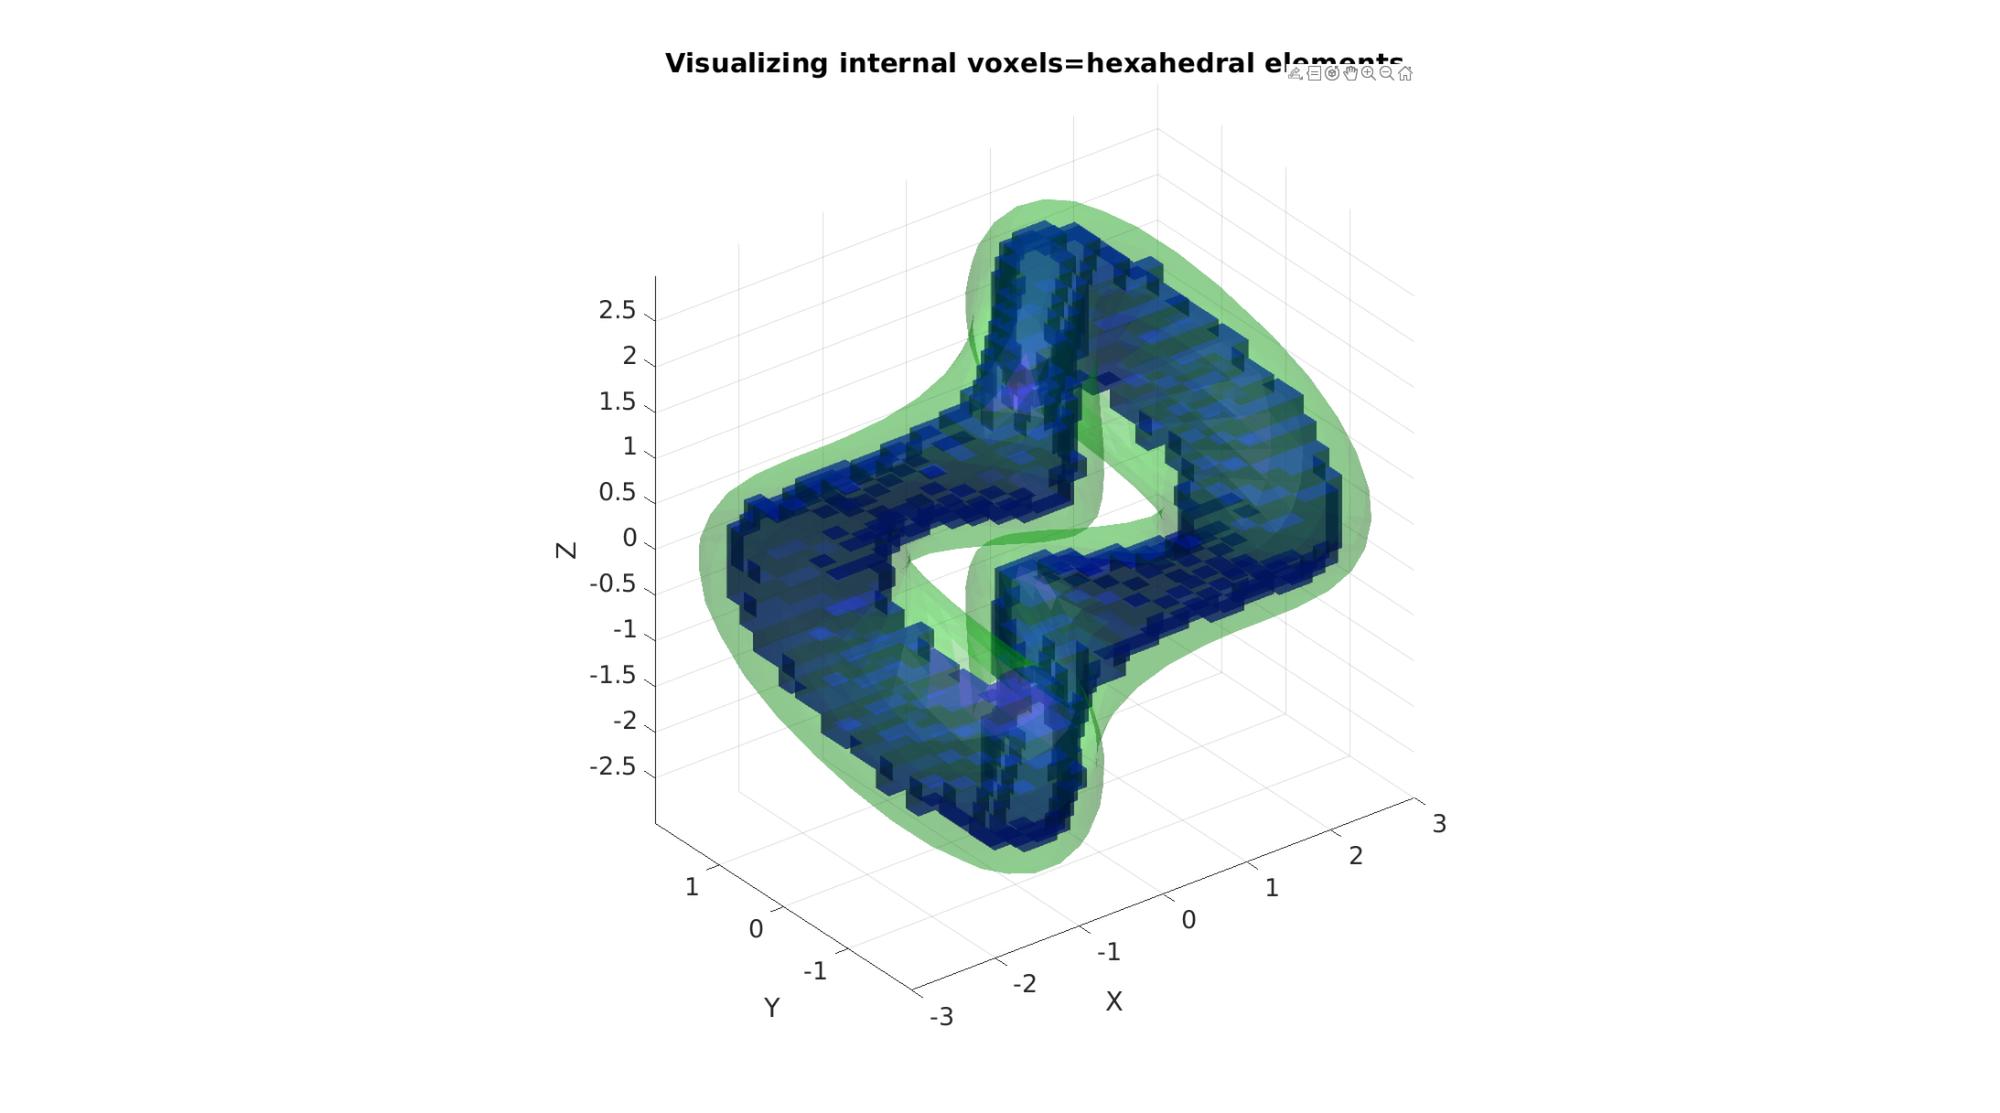
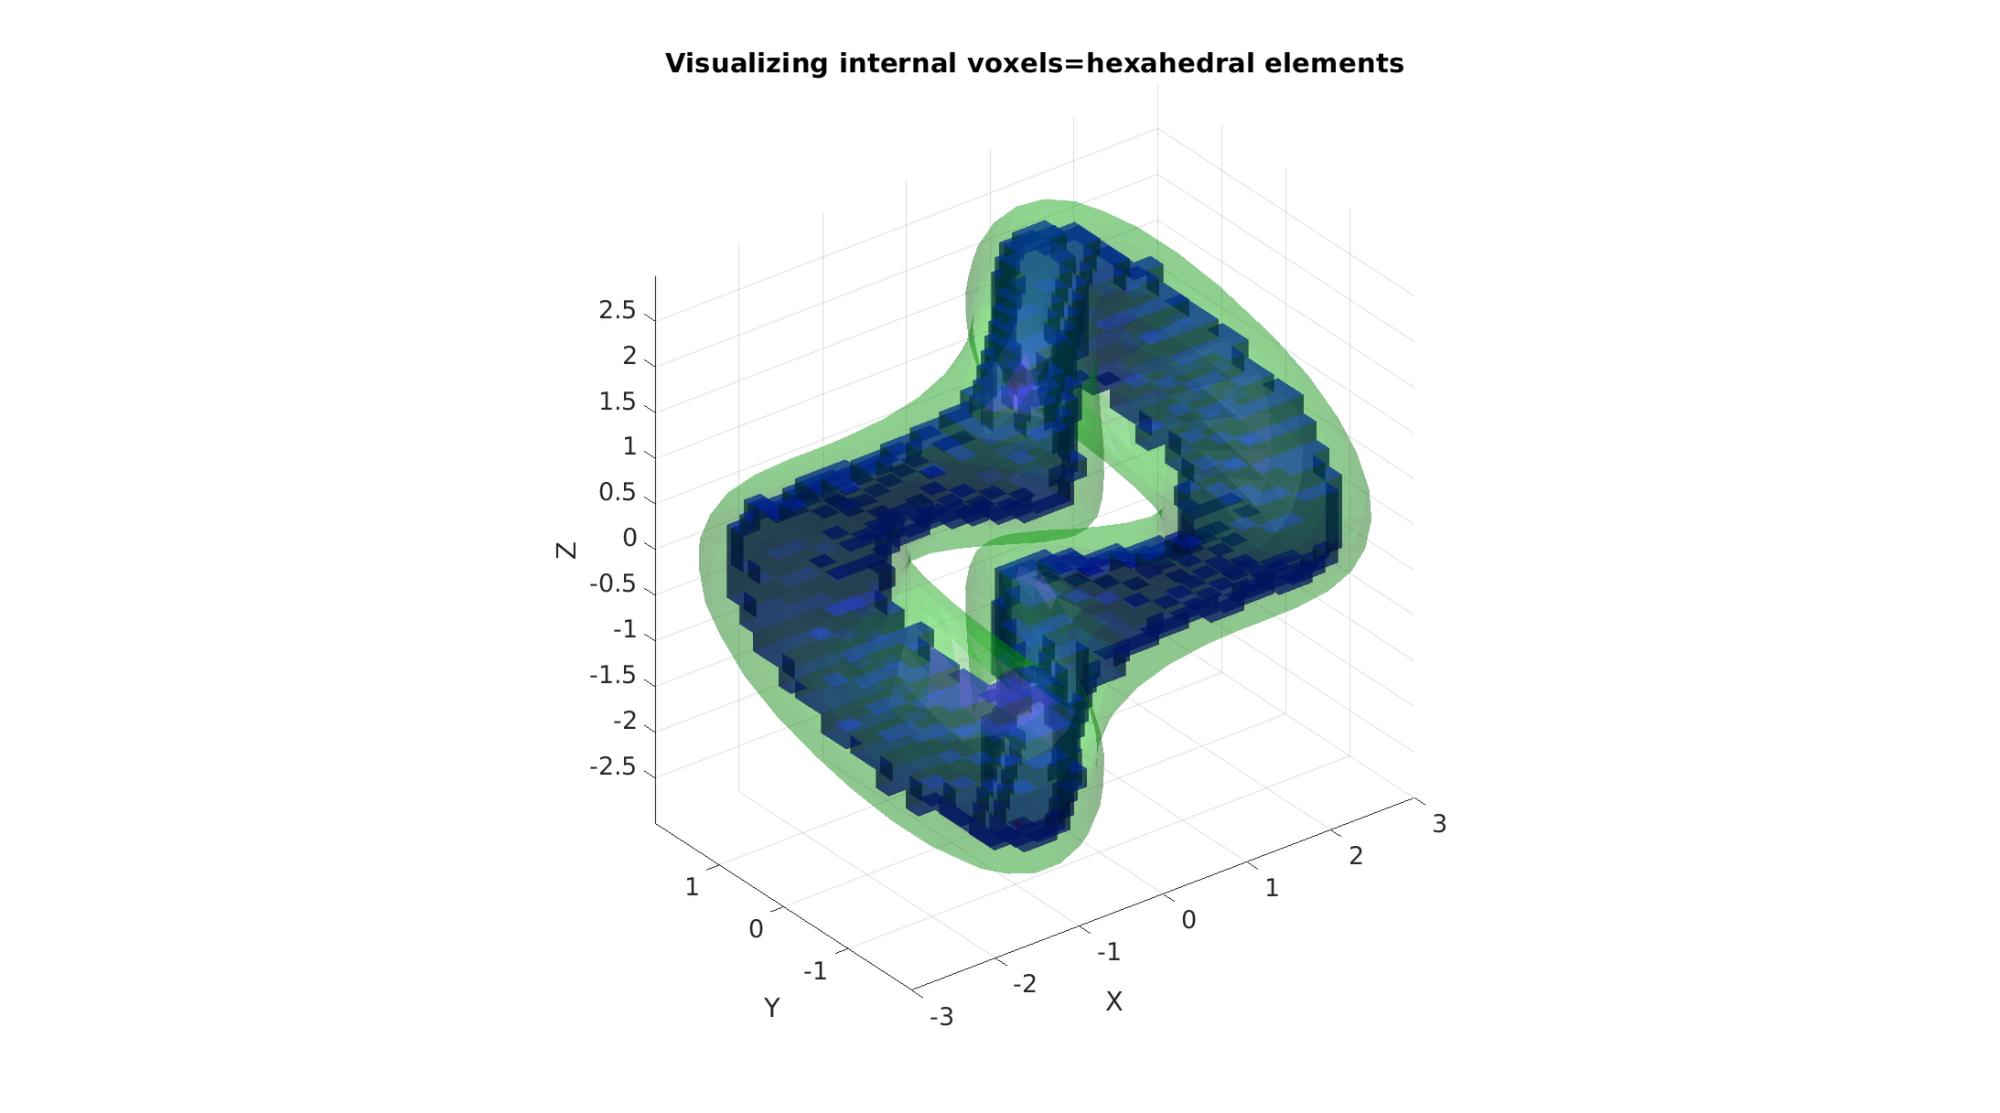
GET HEXAHEDRAL ELEMENT SET
L_model=(M==2); %Interior&Boundary choosen here

%Defining erosion/dilation kernel
k=3;
p=k-round(k./2);
hb=zeros(3,3);
hb(2,2,2)=1;
hb(2,2,1)=1;
hb(2,2,3)=1;
hb(1,2,2)=1;
hb(3,2,2)=1;
hb(2,3,2)=1;
hb(2,1,2)=1;

L_model_rep=zeros(size(L_model)+(2.*p));
L_model_rep(p+(1:size(L_model,1)),p+(1:size(L_model,2)),p+(1:size(L_model,3)))=L_model;
L_model_blur = convn(double(L_model_rep),hb,'valid');
L_model=L_model_blur>=(sum(hb(:)));

[E_hex,V_hex,C_hex]=ind2patch(L_model,M,'hu');

% Convert Coordinates
[V_hex(:,1),V_hex(:,2),V_hex(:,3)]=im2cart(V_hex(:,2),V_hex(:,1),V_hex(:,3),voxelSize*ones(1,3));
V_hex=V_hex+imOrigin(ones(size(V_hex,1),1),:);

% Use element2patch to get patch data to plot the model
[F_hex,C_hex_F]=element2patch(E_hex,C_hex);

%Pass through unique_patch to reduce "weight" of plot
[Fp,Vp,~,~,~,F_count]=unique_patch(F_hex,V_hex,[],5);
logicUni=F_count==1; %Logic for boundary faces

Fq=Fp(logicUni,:);
Vq=Vp;
[Fq,Vq,~]=patchCleanUnused(Fq,Vq);

[Ft,Vt]=quad2tri(Fq,Vq,'b');
Plotting the results
hf1=cFigure;
title('Visualizing internal voxels=hexahedral elements','FontSize',fontSize);
xlabel('X','FontSize',fontSize);ylabel('Y','FontSize',fontSize); zlabel('Z','FontSize',fontSize);
hold on;
patch('Faces',Fs,'Vertices',Vs,'FaceColor','g','EdgeColor','none','FaceAlpha',0.25);
patch('Faces',Ft,'Vertices',Vt,'FaceColor','b','EdgeColor','none','FaceAlpha',0.5);

camlight('headlight'); lighting flat;
axis equal; view(3); axis tight;  grid on;  set(gca,'FontSize',fontSize);
drawnow;
%Joining surface sets
F=[Fs;Ft+size(Vs,1)];
V=[Vs;Vt];
C_tet=[ones(size(Fs,1),1);2*ones(size(Ft,1),1)]; %Surface marker colors
Get hole point
[V_hole]=getInnerPoint(Ft,Vt,searchRadius,voxelSize/2,0);
plotV(V_hole,'r.','MarkerSize',25);

Get region point
L_in=(M==1);

[indInternal]=getInnerVoxel(double(L_in),searchRadius,0);

[I_in,J_in,K_in]=ind2sub(size(L_in),indInternal); %Convert to subscript coordinates
[X_in,Y_in,Z_in]=im2cart(I_in,J_in,K_in,voxelSize*ones(1,3));
V_in=[X_in Y_in Z_in];
V_in=V_in+imOrigin(ones(size(V_in,1),1),:);

plotV(V_in,'k.','MarkerSize',25);

DEFINE FACE BOUNDARY MARKERS
faceBoundaryMarker=C_tet;
Define region points
V_regions=[V_in];
Define hole points
V_holes=[V_hole];
Regional mesh parameters
[edgeLengths]=patchEdgeLengths(F,V);
edgeLengthsMean=mean(edgeLengths);
meanProposedVolume=edgeLengthsMean^3./(6*sqrt(2)); %For regular tetrahedron
regionA=meanProposedVolume;
CREATING THE SMESH STRUCTURE, meshing without the surface constraints imposed by the -Y this time.
stringOpt='-pq1.2AaYQV';

modelName='tetGenModel';
smeshName=[modelName,'.smesh'];

smeshStruct.stringOpt=stringOpt;
smeshStruct.Faces=F;
smeshStruct.Nodes=V;
smeshStruct.holePoints=V_holes;
smeshStruct.faceBoundaryMarker=faceBoundaryMarker; %Face boundary markers
smeshStruct.regionPoints=V_regions; %region points
smeshStruct.regionA=regionA;
smeshStruct.minRegionMarker=2; %Minimum region marker
smeshStruct.smeshName=smeshName;
Mesh model using tetrahedral elements using tetGen (see: http://wias-berlin.de/software/tetgen/)
[meshOutput]=runTetGen(smeshStruct); %Run tetGen
%%%%%%%%%%%%%%%%%%%%%%%%%%%%%%%%%%%%%%%%%%%%%
--- TETGEN Tetrahedral meshing --- 20-Apr-2023 10:34:43
Warning: smeshStruct.smeshName input will be replaced by smeshStruct.modelName
in future releases!

%%%%%%%%%%%%%%%%%%%%%%%%%%%%%%%%%%%%%%%%%%%%%
--- Writing SMESH file --- 20-Apr-2023 10:34:43
Warning: smeshStruct.smeshName input will be replaced by smeshStruct.modelName
in future releases!
----> Adding node field
----> Adding facet field
----> Adding holes specification
----> Adding region specification
--- Done --- 20-Apr-2023 10:34:43
--- Running TetGen to mesh input boundary--- 20-Apr-2023 10:34:43
Opening /mnt/data/MATLAB/GIBBON/data/temp/tetGenModel.smesh.
--- Done --- 20-Apr-2023 10:34:43

%%%%%%%%%%%%%%%%%%%%%%%%%%%%%%%%%%%%%%%%%%%%%
--- Importing TetGen files --- 20-Apr-2023 10:34:43
--- Done --- 20-Apr-2023 10:34:43
Access model element and patch data
F_tet=meshOutput.faces;
V_tet=meshOutput.nodes;
C_tet=meshOutput.faceMaterialID;
E_tet=meshOutput.elements;

indBoundary=meshOutput.facesBoundary(meshOutput.boundaryMarker==1,:);
indBoundary=unique(indBoundary(:));
MERGING NODE SETS
V=[V_tet;V_hex];
E_hex=E_hex+size(V_tet,1);

[~,V,ind1,ind2]=mergeVertices(F_tet,V);

E_tet=ind2(E_tet);
E_hex=ind2(E_hex);
indBoundary=ind2(indBoundary);

E={E_tet, E_hex};
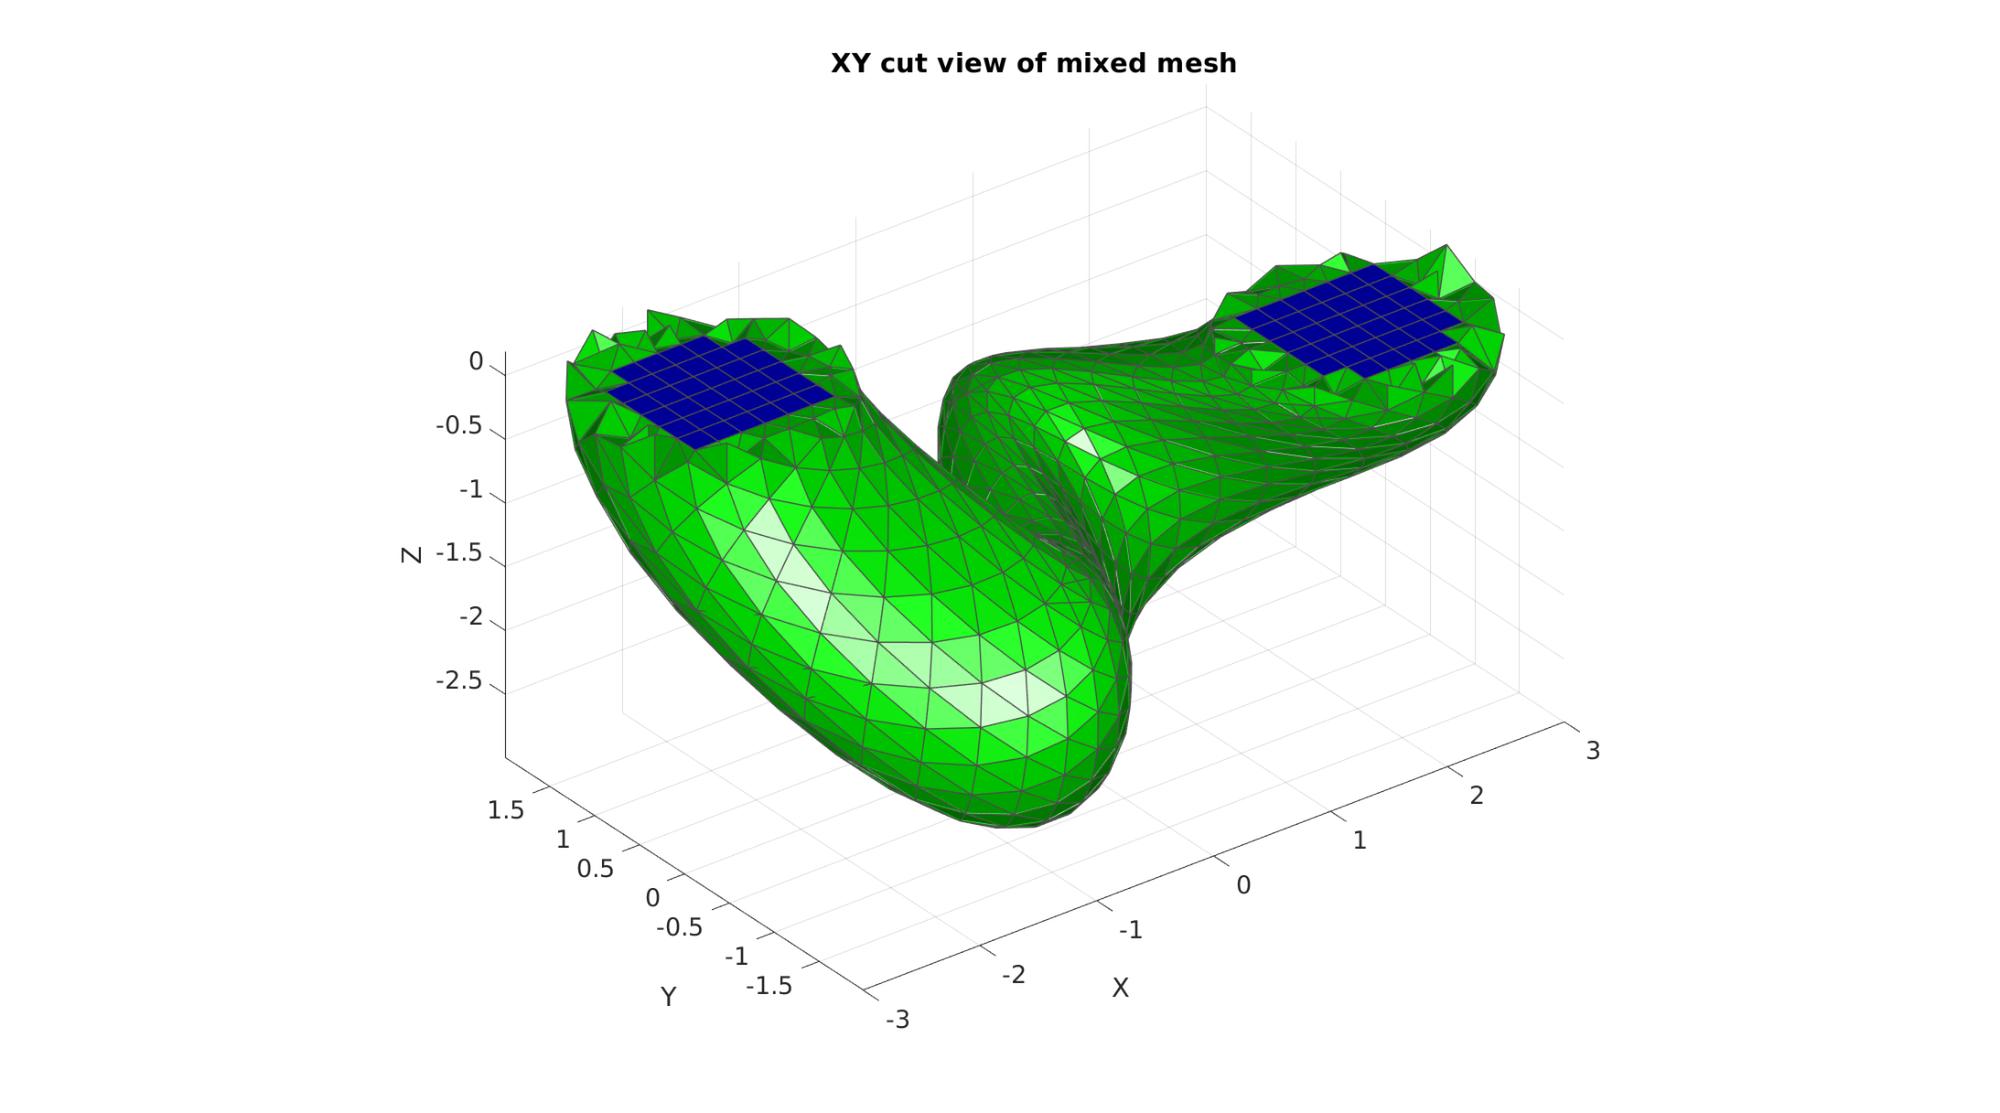
PLOTTING MODEL
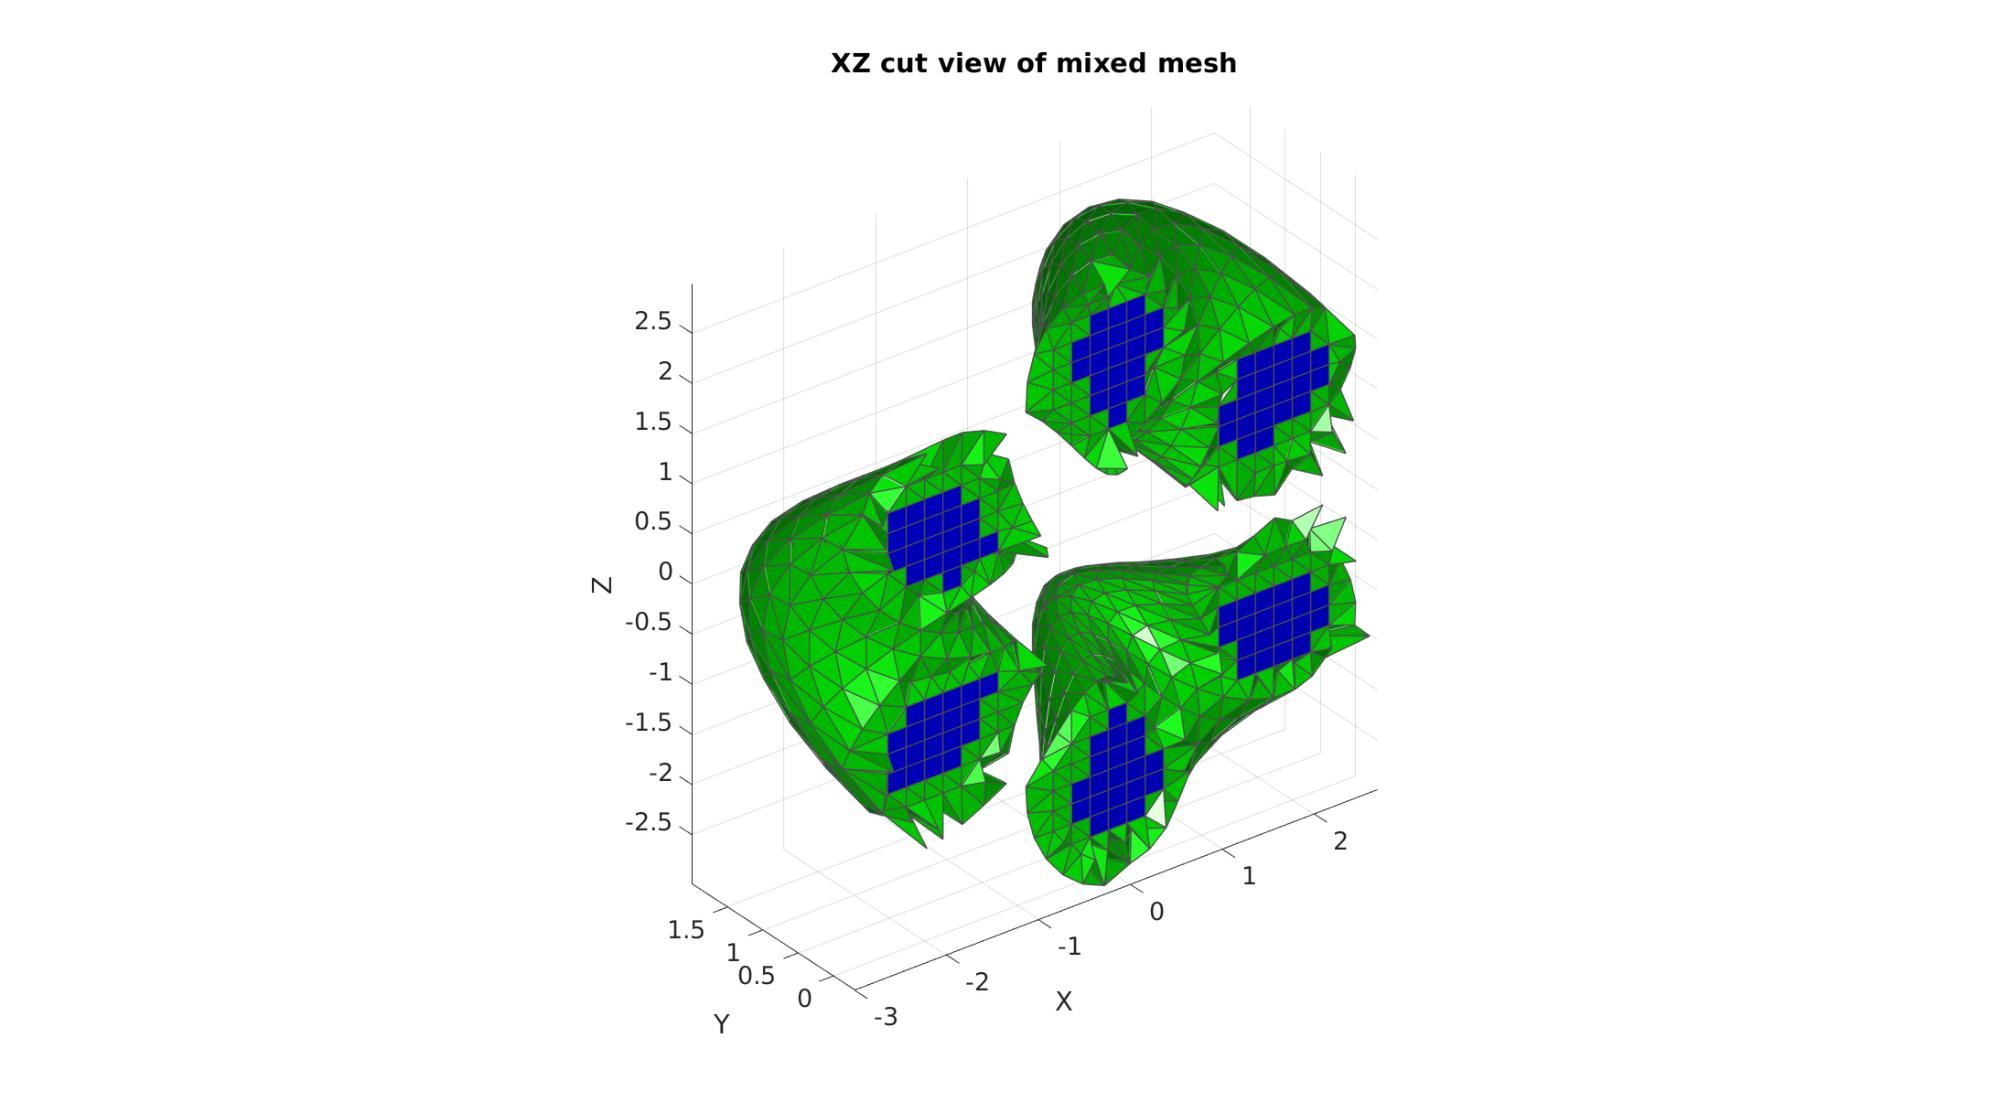
hf1=cFigure;
% subplot(1,2,1);
title('XY cut view of mixed mesh','FontSize',fontSize);
xlabel('X','FontSize',fontSize); ylabel('Y','FontSize',fontSize); zlabel('Z','FontSize',fontSize); hold on;

%Selecting half of the model to see interior
X=V(:,3); XE=mean(X(E{1}),2);
L=XE<mean(X);
[Fs,Cs]=element2patch(E{1}(L,:),C_tet(L));

%Selecting half of the model to see interior
X=V(:,3); XE=mean(X(E{2}),2);
L=XE<mean(X);
[Fh,Ch]=element2patch(E{2}(L,:),C_hex(L));

hps=patch('Faces',Fs,'Vertices',V,'FaceColor','g','lineWidth',edgeWidth,'edgeColor',edgeColor,'FaceAlpha',1);
hps2=patch('Faces',Fh,'Vertices',V,'FaceColor','b','lineWidth',edgeWidth,'edgeColor',edgeColor,'FaceAlpha',1);
view(3); axis tight;  axis equal;  grid on;
colormap(autumn);
camlight headlight;
set(gca,'FontSize',fontSize);
drawnow;

hf1=cFigure;
% subplot(1,2,2);
title('XZ cut view of mixed mesh','FontSize',fontSize);
xlabel('X','FontSize',fontSize); ylabel('Y','FontSize',fontSize); zlabel('Z','FontSize',fontSize); hold on;

%Selecting half of the model to see interior
X=V(:,2); XE=mean(X(E{1}),2);
L=XE>mean(X);
[Fs,Cs]=element2patch(E{1}(L,:),C_tet(L));

%Selecting half of the model to see interior
X=V(:,2); XE=mean(X(E{2}),2);
L=XE>mean(X);
[Fh,Ch]=element2patch(E{2}(L,:),C_hex(L));

hps=patch('Faces',Fs,'Vertices',V,'FaceColor','g','lineWidth',edgeWidth,'edgeColor',edgeColor,'FaceAlpha',1);
hps2=patch('Faces',Fh,'Vertices',V,'FaceColor','b','lineWidth',edgeWidth,'edgeColor',edgeColor,'FaceAlpha',1);

view(3); axis tight;  axis equal;  grid on;
colormap(autumn);
camlight headlight;
set(gca,'FontSize',fontSize);

drawnow;

cPar.Method='LAP';
cPar.n=25;
cPar.RigidConstraints=indBoundary;

[F1,~]=element2patch(E{1},[]);
[F1,~,~]=uniqueIntegerRow(F1);
[F2,~]=element2patch(E{2},[]);
[F2,~,~]=uniqueIntegerRow(F2);
[~,IND_V1,~]=tesIND(F1,V,0);
[~,IND_V2,~]=tesIND(F2,V,0);

IND_V=[IND_V1 IND_V2];

[VS]=tesSmooth([],V,IND_V,cPar);
PLOTTING MODEL
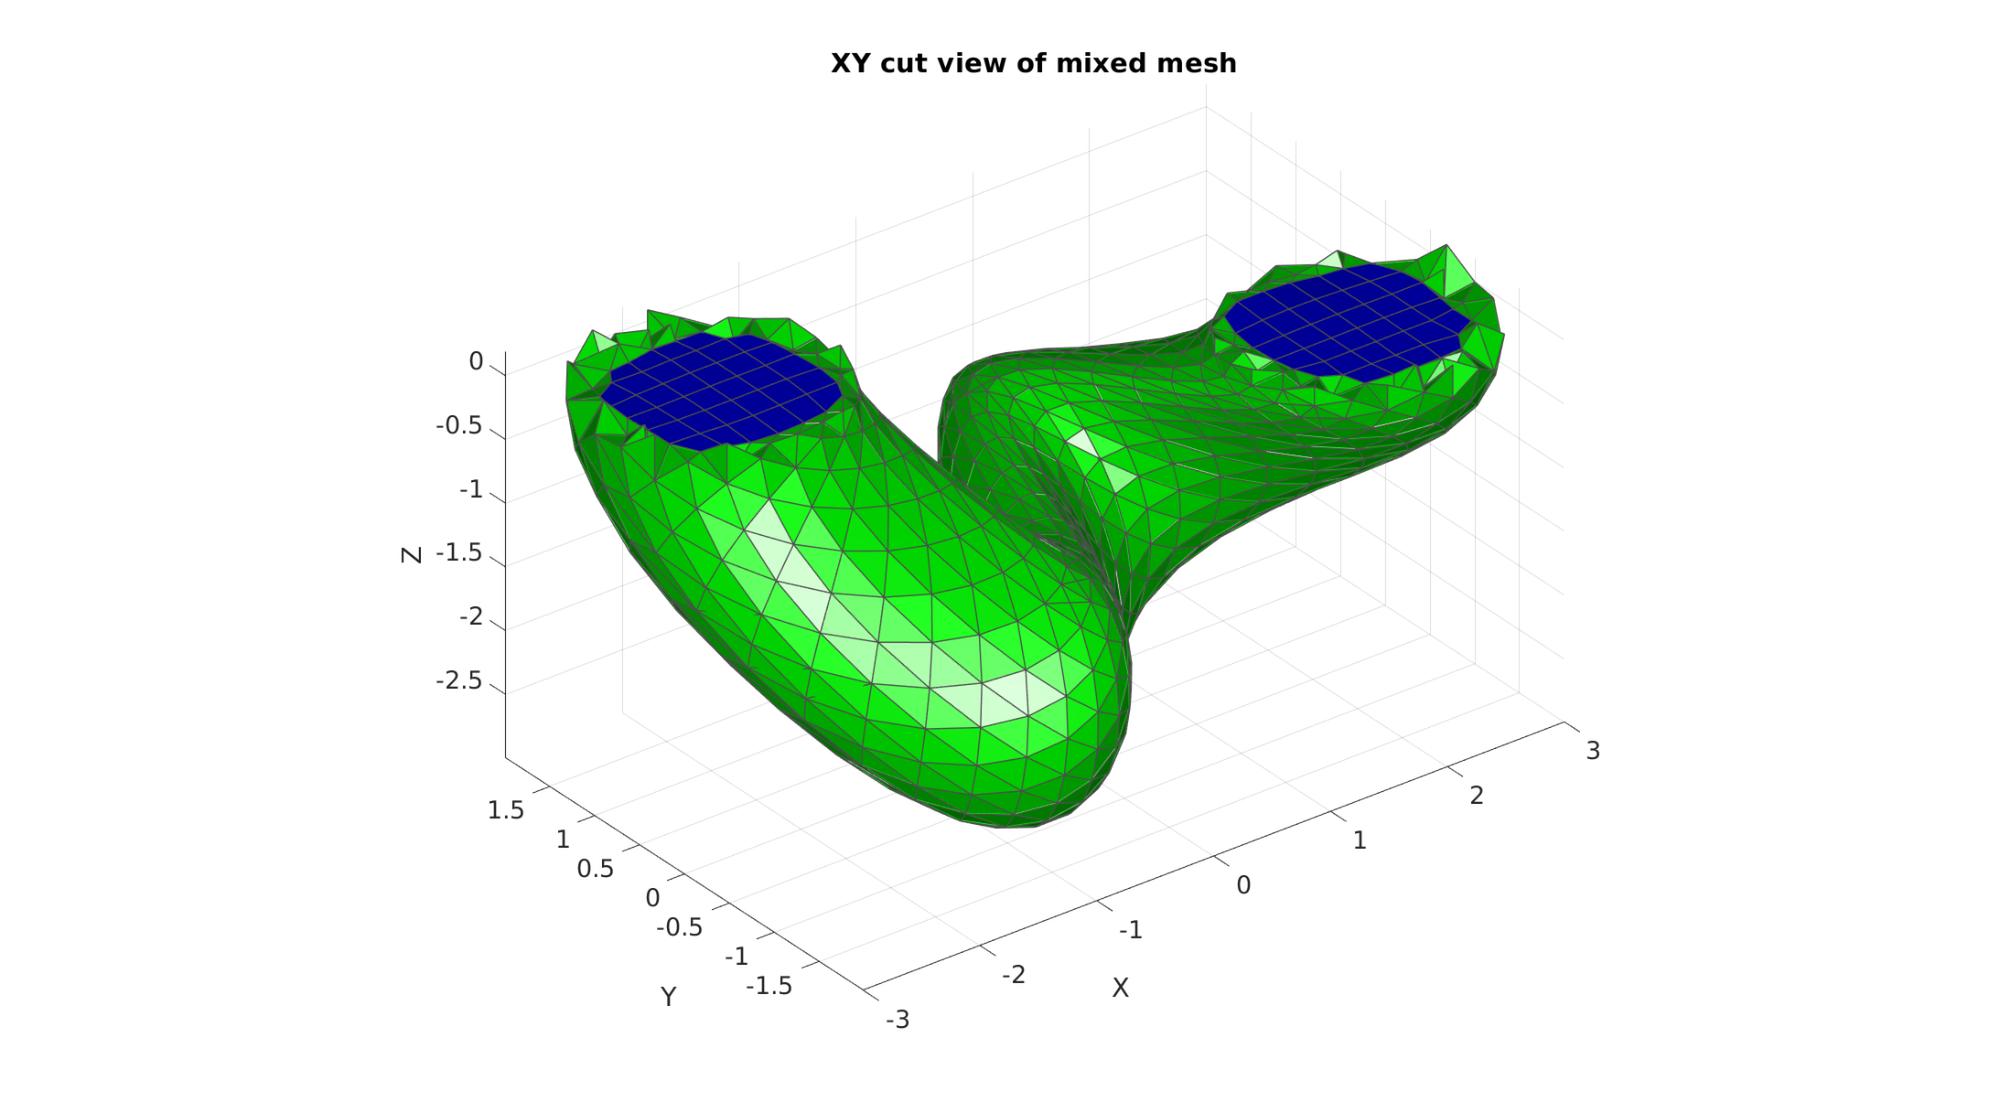
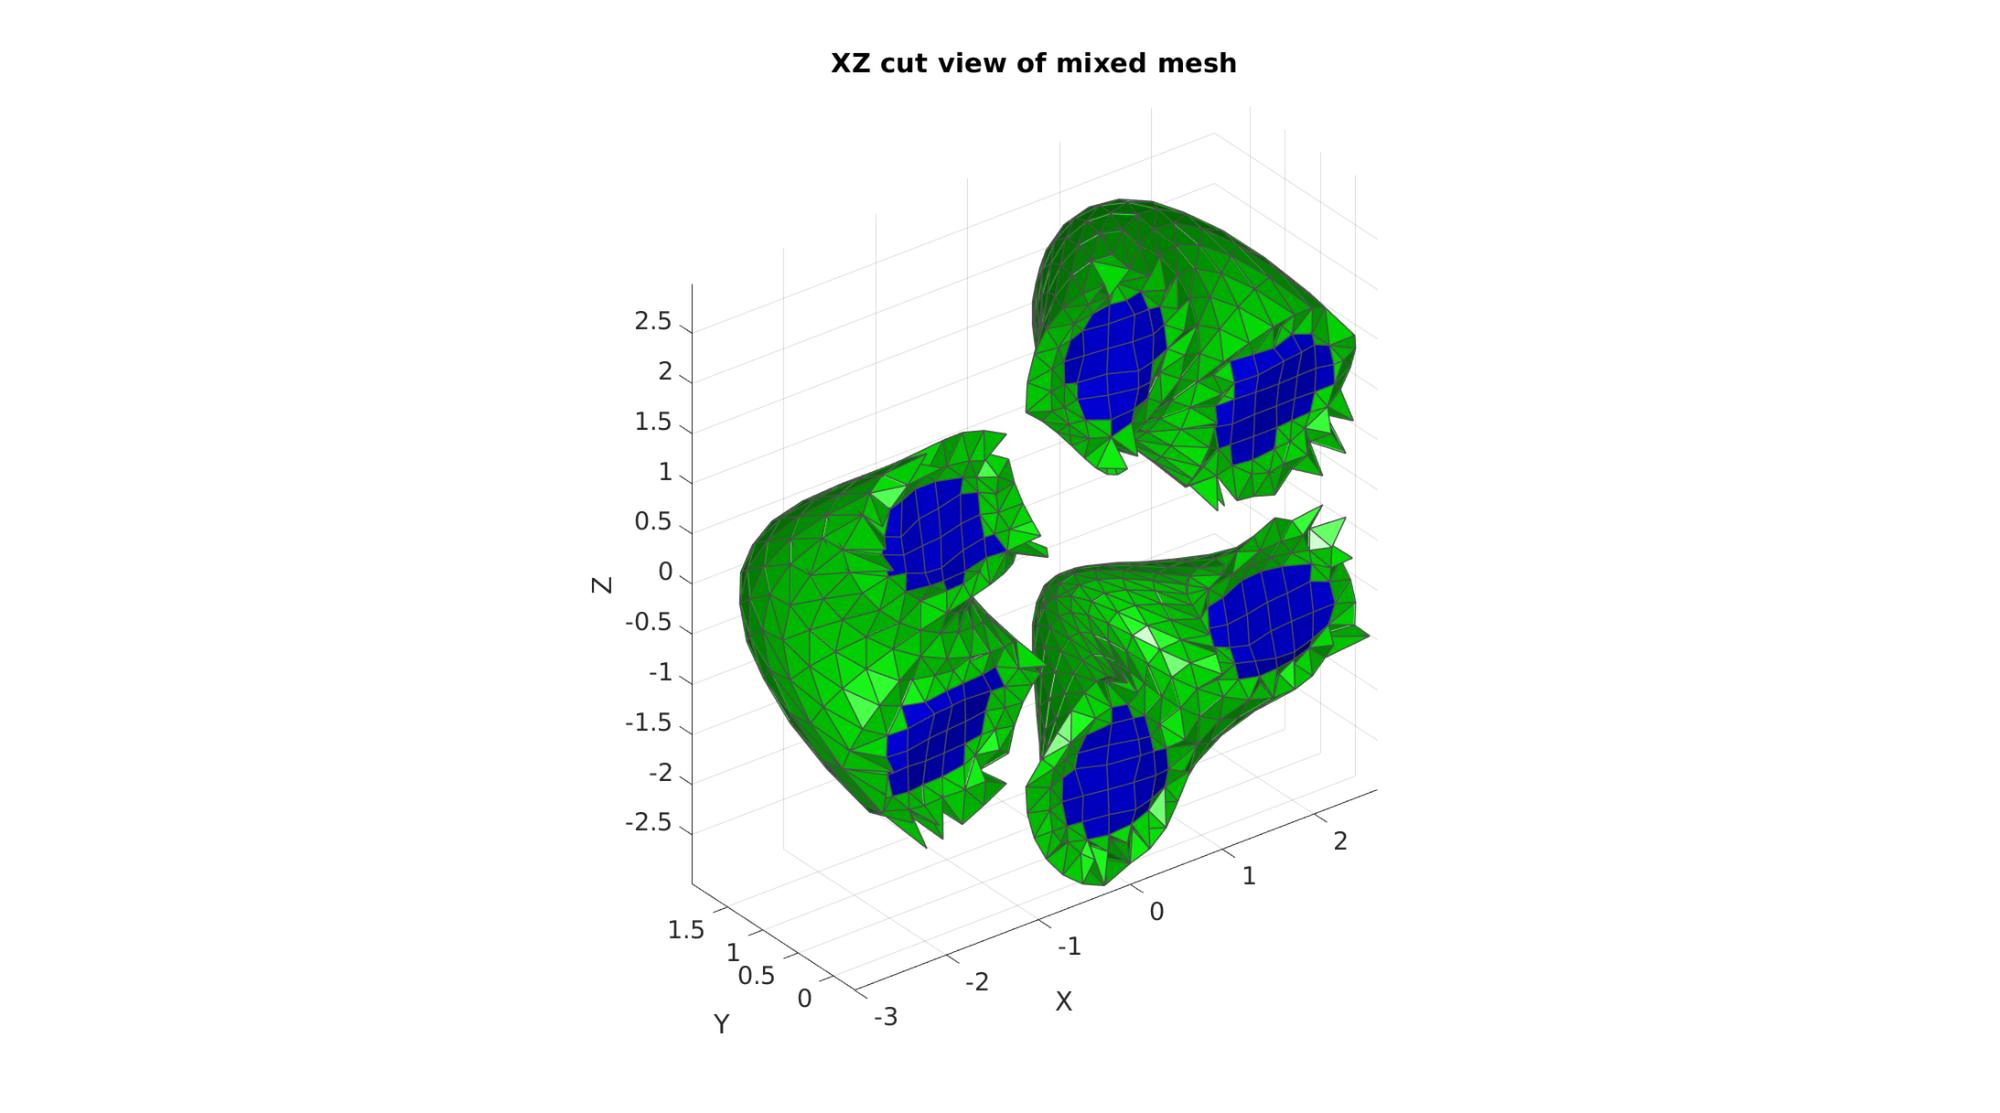
hf1=cFigure;
% subplot(1,2,1);
title('XY cut view of mixed mesh','FontSize',fontSize);
xlabel('X','FontSize',fontSize); ylabel('Y','FontSize',fontSize); zlabel('Z','FontSize',fontSize); hold on;

%Selecting half of the model to see interior
X=V(:,3); XE=mean(X(E{1}),2);
L=XE<mean(X);
[Fs,Cs]=element2patch(E{1}(L,:),C_tet(L));

%Selecting half of the model to see interior
X=V(:,3); XE=mean(X(E{2}),2);
L=XE<mean(X);
[Fh,Ch]=element2patch(E{2}(L,:),C_hex(L));

hps=patch('Faces',Fs,'Vertices',VS,'FaceColor','g','lineWidth',edgeWidth,'edgeColor',edgeColor,'FaceAlpha',1);
hps2=patch('Faces',Fh,'Vertices',VS,'FaceColor','b','lineWidth',edgeWidth,'edgeColor',edgeColor,'FaceAlpha',1);
view(3); axis tight;  axis equal;  grid on;
colormap(autumn);
camlight headlight;
set(gca,'FontSize',fontSize);
drawnow;

hf1=cFigure;
% subplot(1,2,2);
title('XZ cut view of mixed mesh','FontSize',fontSize);
xlabel('X','FontSize',fontSize); ylabel('Y','FontSize',fontSize); zlabel('Z','FontSize',fontSize); hold on;

%Selecting half of the model to see interior
X=V(:,2); XE=mean(X(E{1}),2);
L=XE>mean(X);
[Fs,Cs]=element2patch(E{1}(L,:),C_tet(L));

%Selecting half of the model to see interior
X=V(:,2); XE=mean(X(E{2}),2);
L=XE>mean(X);
[Fh,Ch]=element2patch(E{2}(L,:),C_hex(L));

hps=patch('Faces',Fs,'Vertices',VS,'FaceColor','g','lineWidth',edgeWidth,'edgeColor',edgeColor,'FaceAlpha',1);
hps2=patch('Faces',Fh,'Vertices',VS,'FaceColor','b','lineWidth',edgeWidth,'edgeColor',edgeColor,'FaceAlpha',1);

view(3); axis tight;  axis equal;  grid on;
colormap(autumn);
camlight headlight;
set(gca,'FontSize',fontSize);

drawnow;

GIBBON
Kevin M. Moerman ([email protected])
GIBBON footer text
License: https://github.com/gibbonCode/GIBBON/blob/master/LICENSE
GIBBON: The Geometry and Image-based Bioengineering add-On. A toolbox for image segmentation, image-based modeling, meshing, and finite element analysis.
Copyright (C) 2006-2022 Kevin Mattheus Moerman and the GIBBON contributors
This program is free software: you can redistribute it and/or modify it under the terms of the GNU General Public License as published by the Free Software Foundation, either version 3 of the License, or (at your option) any later version.
This program is distributed in the hope that it will be useful, but WITHOUT ANY WARRANTY; without even the implied warranty of MERCHANTABILITY or FITNESS FOR A PARTICULAR PURPOSE. See the GNU General Public License for more details.
You should have received a copy of the GNU General Public License along with this program. If not, see http://www.gnu.org/licenses/.