cart2im
Below is a demonstration of the features of the cart2im function
Contents
clear; close all; clc;
Syntax
[I,J,K]=cart2im(X,Y,Z,v);
Description
This function converts the cartesian coordinates X,Y,Z to image coordinates I,J,K using the voxel dimension v.
X,Y,Z can be scalars, vectors or matrices. v is a vector of length 3 where v(1), v(2) and v(3) correspond to the voxel dimensions in the x,y and z direction respectively.
Examples
Plot settings
cMap=gjet(250);
faceAlpha1=0.5;
edgeColor1='none';
edgeColor2='none';
fontSize=15;
Example: Using im2cart and cart2im to convert from image to real world coordinates
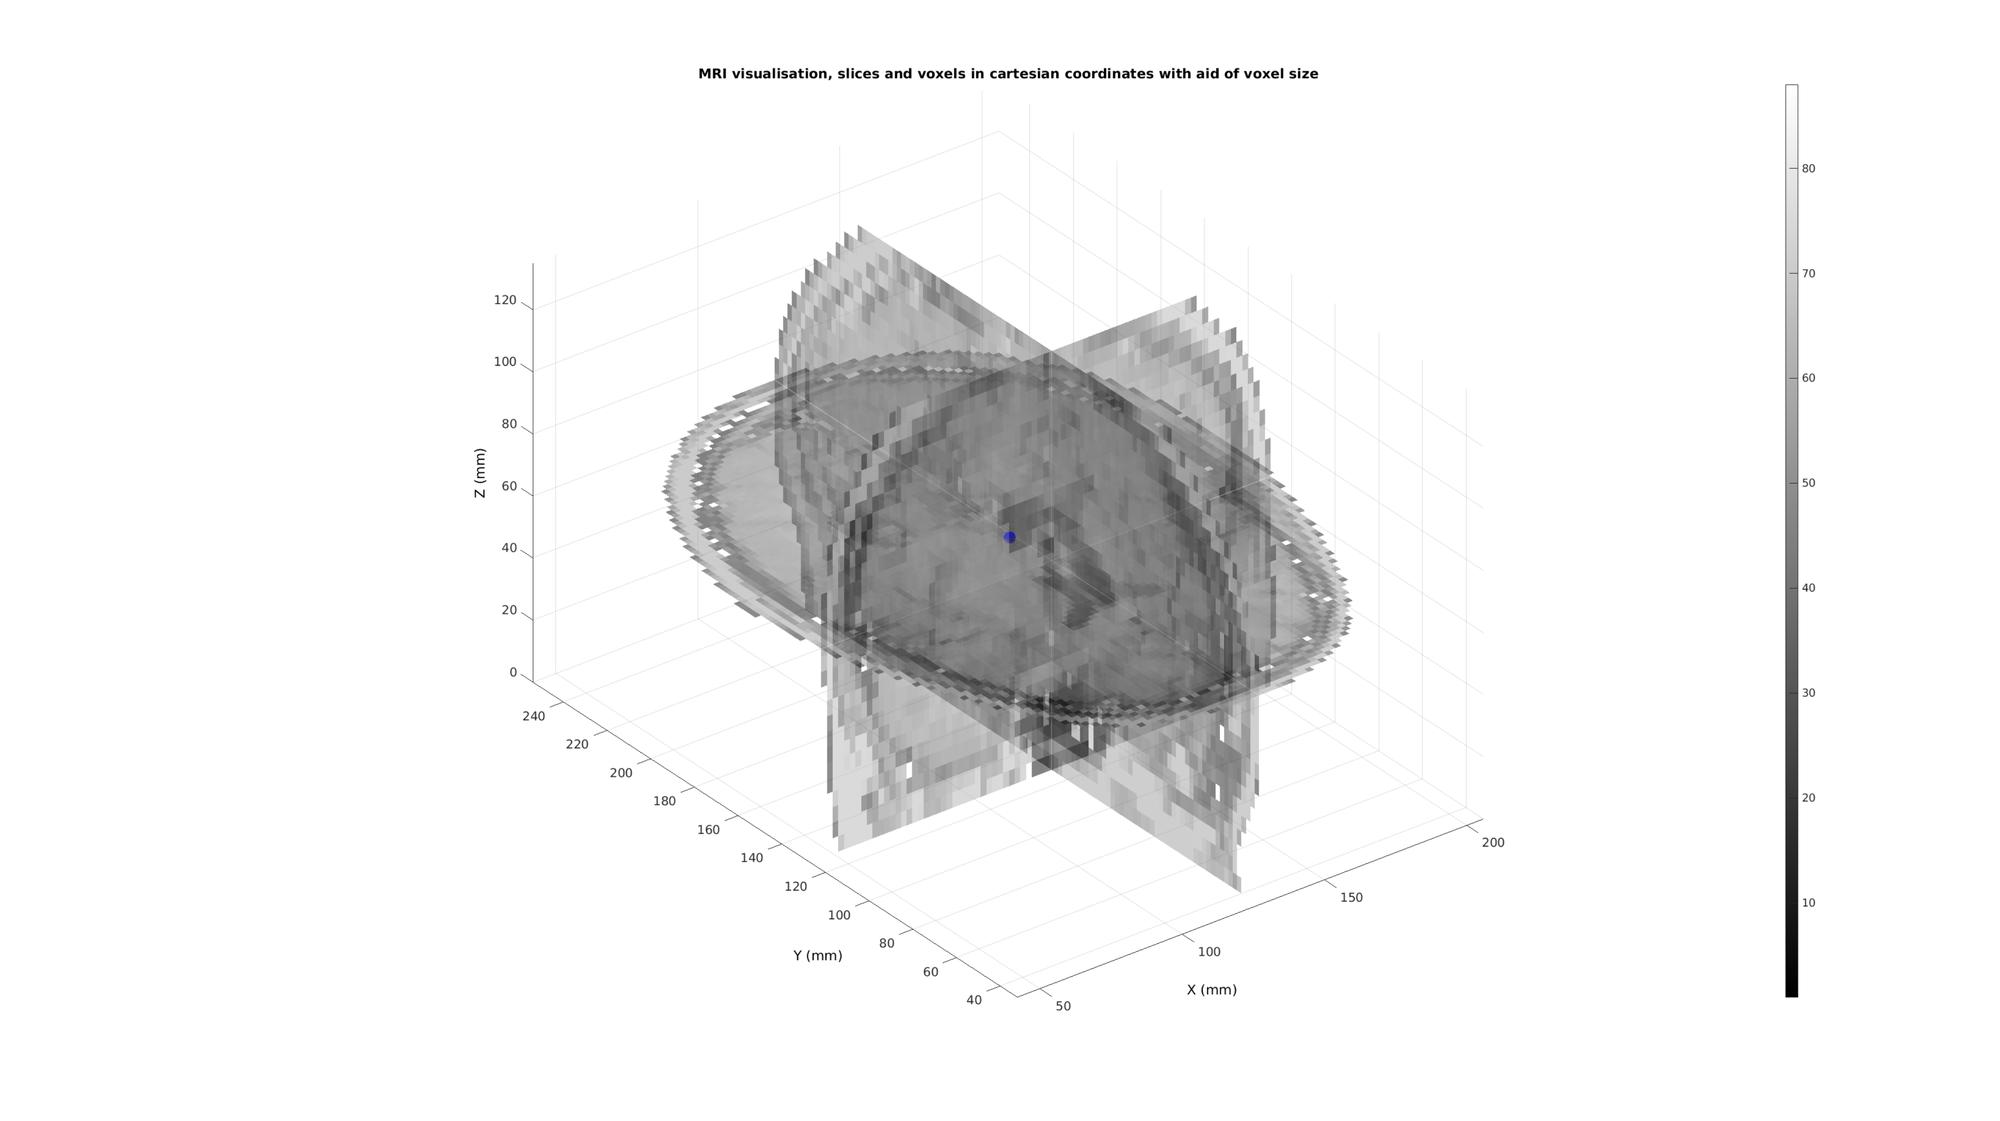
% Get a 3D image
load mri;
M=squeeze(D); %example image data set
v=[2 2 5]; %example voxel size, not voxels are ellongated in slice direction
The voxels to display can be specified as a list (vector) of voxels numbers (linear indices) or using a mask (logic array).
%Defining row, column and slice indicices for slice patching
sliceIndexI=round(size(M,1)/2); %(close to) middle row
sliceIndexJ=round(size(M,2)/2); %(close to) middle column
sliceIndexK=round(size(M,3)/2); %(close to) middle slice

%Defining "masks" i.e. logic arrays with ones for voxels of interest
logicSliceI=false(size(M));
logicSliceI(sliceIndexI,:,:)=1;
logicSliceI=logicSliceI & M>0;

logicSliceJ=false(size(M));
logicSliceJ(:,sliceIndexJ,:)=1;
logicSliceJ=logicSliceJ & M>0;

logicSliceK=false(size(M));
logicSliceK(:,:,sliceIndexK)=1;
logicSliceK=logicSliceK & M>0;

% Creating patch data
[Fx,Vx,Cx]=ind2patch(logicSliceJ,M,'sj');
[Fy,Vy,Cy]=ind2patch(logicSliceI,M,'si');
[Fz,Vz,Cz]=ind2patch(logicSliceK,M,'sk');

% Convert image coordinates to cartesian coordinates
[Vx(:,1),Vx(:,2),Vx(:,3)]=im2cart(Vx(:,2),Vx(:,1),Vx(:,3),v);
[Vy(:,1),Vy(:,2),Vy(:,3)]=im2cart(Vy(:,2),Vy(:,1),Vy(:,3),v);
[Vz(:,1),Vz(:,2),Vz(:,3)]=im2cart(Vz(:,2),Vz(:,1),Vz(:,3),v);

h8=cFigure;
title('MRI visualisation, slices and voxels in cartesian coordinates with aid of voxel size');
xlabel('X (mm)');ylabel('Y (mm)'); zlabel('Z (mm)'); hold on;
hp2= patch('Faces',Fx,'Vertices',Vx,'FaceColor','flat','CData',Cx,'EdgeColor',edgeColor2,'FaceAlpha',faceAlpha1);
hp3= patch('Faces',Fy,'Vertices',Vy,'FaceColor','flat','CData',Cy,'EdgeColor',edgeColor2,'FaceAlpha',faceAlpha1);
hp4= patch('Faces',Fz,'Vertices',Vz,'FaceColor','flat','CData',Cz,'EdgeColor',edgeColor2,'FaceAlpha',faceAlpha1);
axis equal; view(3); axis tight; axis vis3d; grid on;
colormap(gray(250)); colorbar;
camlight headlight;
set(gca,'fontSize',fontSize);
drawnow;

Get example cartesian coordinates to map to image coordinates
vMid=mean(Vz,1);
plotV(vMid,'b.','MarkerSize',50);
Map to image coordinates using cart2im
[i,j,k]=im2cart(vMid(:,2),vMid(:,1),vMid(:,3),v);

%Image coordinates for the point are
disp(num2str([i j k]));

%Which means the indices for the voxel containing the point are
disp(num2str(round([i j k])));
249.9579      287.4976           335
250  287  335

GIBBON www.gibboncode.org
Kevin Mattheus Moerman, [email protected]
GIBBON footer text
License: https://github.com/gibbonCode/GIBBON/blob/master/LICENSE
GIBBON: The Geometry and Image-based Bioengineering add-On. A toolbox for image segmentation, image-based modeling, meshing, and finite element analysis.
Copyright (C) 2019 Kevin Mattheus Moerman
This program is free software: you can redistribute it and/or modify it under the terms of the GNU General Public License as published by the Free Software Foundation, either version 3 of the License, or (at your option) any later version.
This program is distributed in the hope that it will be useful, but WITHOUT ANY WARRANTY; without even the implied warranty of MERCHANTABILITY or FITNESS FOR A PARTICULAR PURPOSE. See the GNU General Public License for more details.
You should have received a copy of the GNU General Public License along with this program. If not, see http://www.gnu.org/licenses/.