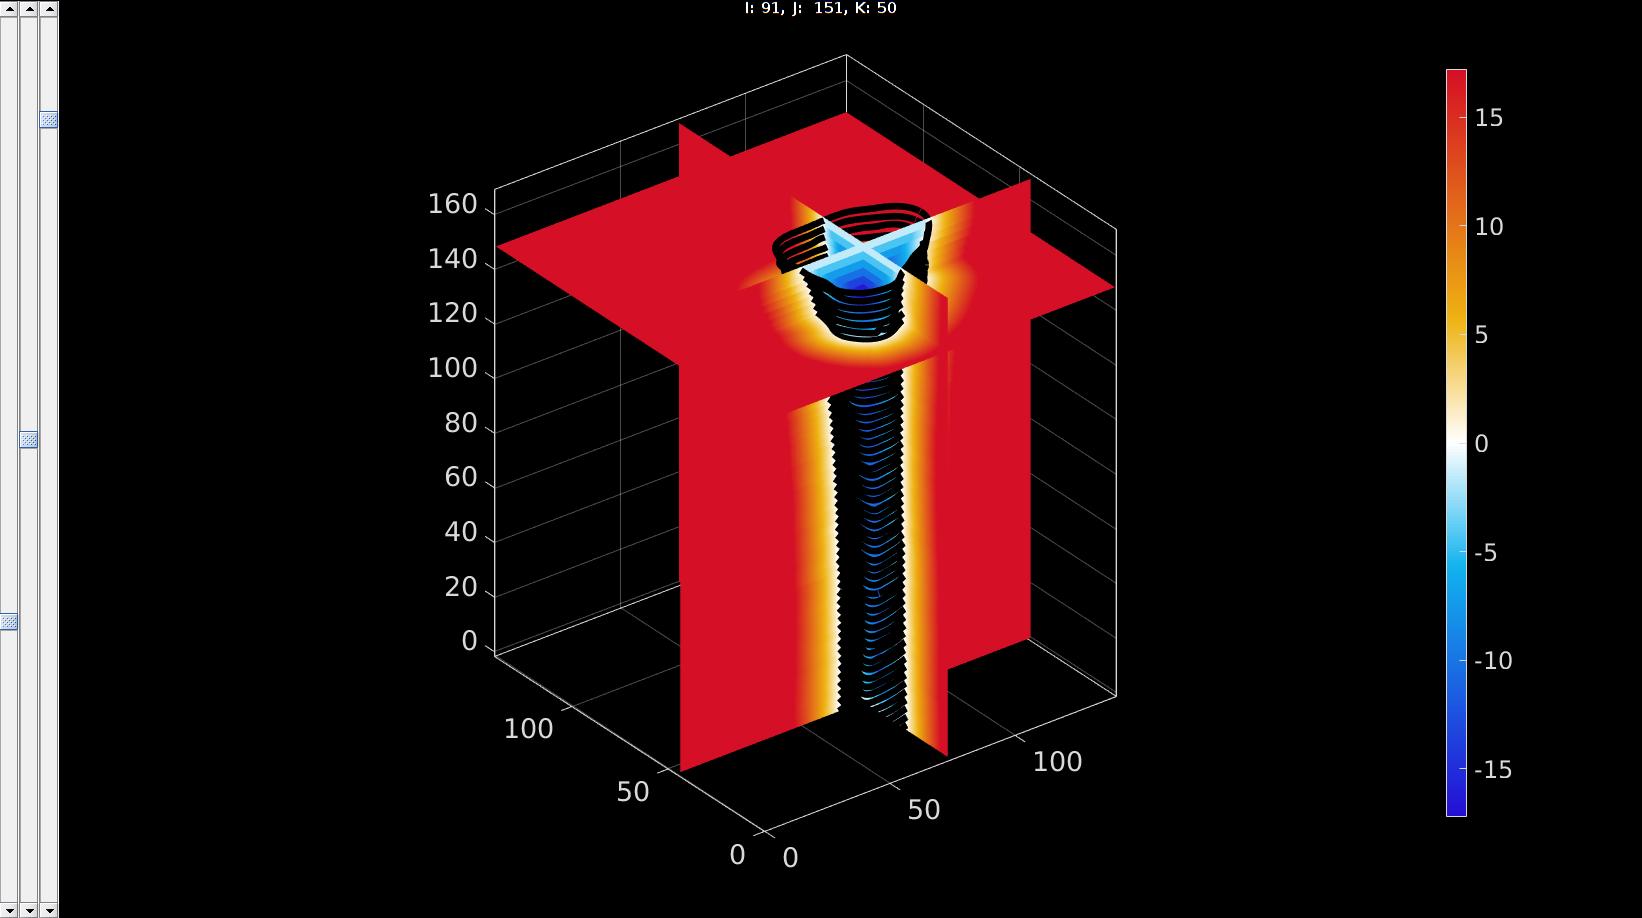
contour2levelset
Below is a demonstration of the features of the contour2levelset function
Contents
clear; close all; clc;
Syntax
[K]=contour2levelset(M,voxelSize,Vcs,levelSetType);
Description
This function converts contours to a levelset image. The outpu levelset image K represents distances to the contour.
The input consists of:
- A 3D image M (or alternatively the size of M).
- The vozelSize a 1x3 vector specifying the size of the voxels in the row, column, and slice direction.
- A cell array Vcs containing one or more contours per slice. If the image has n slices then Vcs should be an nx1 cell array, i.e. contours are defined for each slice.
- The levelSetType, this variable determines the levelset type to use. If it equals 1 then the levelset image is formulated using 2D distances for each slice. If it equals 2 3D distances are computed (most computationally intensive). If it equals 3 the distance metric is the minimum between a 3D distance is based on distance transform and the 2D per slice distances.
Examples
Import image data for this demo
defaultFolder = fileparts(fileparts(mfilename('fullpath'))); %Set main folder
pathNameImageData=fullfile(defaultFolder,'data','DICOM','0001_human_calf');
loadNameImageData=fullfile(pathNameImageData,'IMDAT','IMDAT.mat');
IMDAT_struct=load(loadNameImageData); %The image data structure
G = IMDAT_struct.G; %Geometric/spatial information
v=G.v; %The voxel size
M= IMDAT_struct.type_1; %The image data
contourName='imseg_calf_tibia';
pathName=fullfile(defaultFolder,'data','imseg'); %Folder name for contours
Compute levelset
loadName=fullfile(pathName,contourName);
load(loadName); %Load segmentation structure
Vcs=saveStruct.ContourSet; %Access the contour data

[K]=contour2levelset(M,v,Vcs,2);
Visualize levelset and contours together
%Visualize levelset
vizStruct.colormap=warmcold(250); %Set colormap for levelset visualization
vizStruct.clim=[-abs(min(K(:))) abs(min(K(:)))]; %Set color limits
[~,indMin]=min(K(:)); %assume centre of shape is at lowest value
[i,j,k]=ind2sub(size(M),indMin); %Convert index to subscript indices
vizStruct.sliceIndices=[i,j,k]; %Set indices as slices to plot

hf2=sv3(K,v,vizStruct); %Open slice viewer for levelset

%Visualize contours
optionStruct.Color='k';
plotContours({Vcs},optionStruct);  %Plot contours

drawnow;


GIBBON www.gibboncode.org
Kevin Mattheus Moerman, gibbon.toolbox@gmail.com
GIBBON footer text
License: https://github.com/gibbonCode/GIBBON/blob/master/LICENSE
GIBBON: The Geometry and Image-based Bioengineering add-On. A toolbox for image segmentation, image-based modeling, meshing, and finite element analysis.
Copyright (C) 2019 Kevin Mattheus Moerman
This program is free software: you can redistribute it and/or modify it under the terms of the GNU General Public License as published by the Free Software Foundation, either version 3 of the License, or (at your option) any later version.
This program is distributed in the hope that it will be useful, but WITHOUT ANY WARRANTY; without even the implied warranty of MERCHANTABILITY or FITNESS FOR A PARTICULAR PURPOSE. See the GNU General Public License for more details.
You should have received a copy of the GNU General Public License along with this program. If not, see http://www.gnu.org/licenses/.