dihedralAngles
Below is a demonstration of the features of the dihedralAngles function
Contents
clear; close all; clc;
Syntax
| [A]=dihedralAngles(E,V,elementType);|
Description
This function computes the dihedral angles A for the input elements defined by E, the element nodal connectivity matrix, and V, the node or vertex coordinate matrix. The output array A contains the same number of rows as E (a row for each element), and contains m columns where m is the number of edges for this type of element (e.g. 12 for a hexahedral element or 6 for a tetrahedral element).
Examples
Plot settings
fontSize=20;
faceAlpha1=0.8;
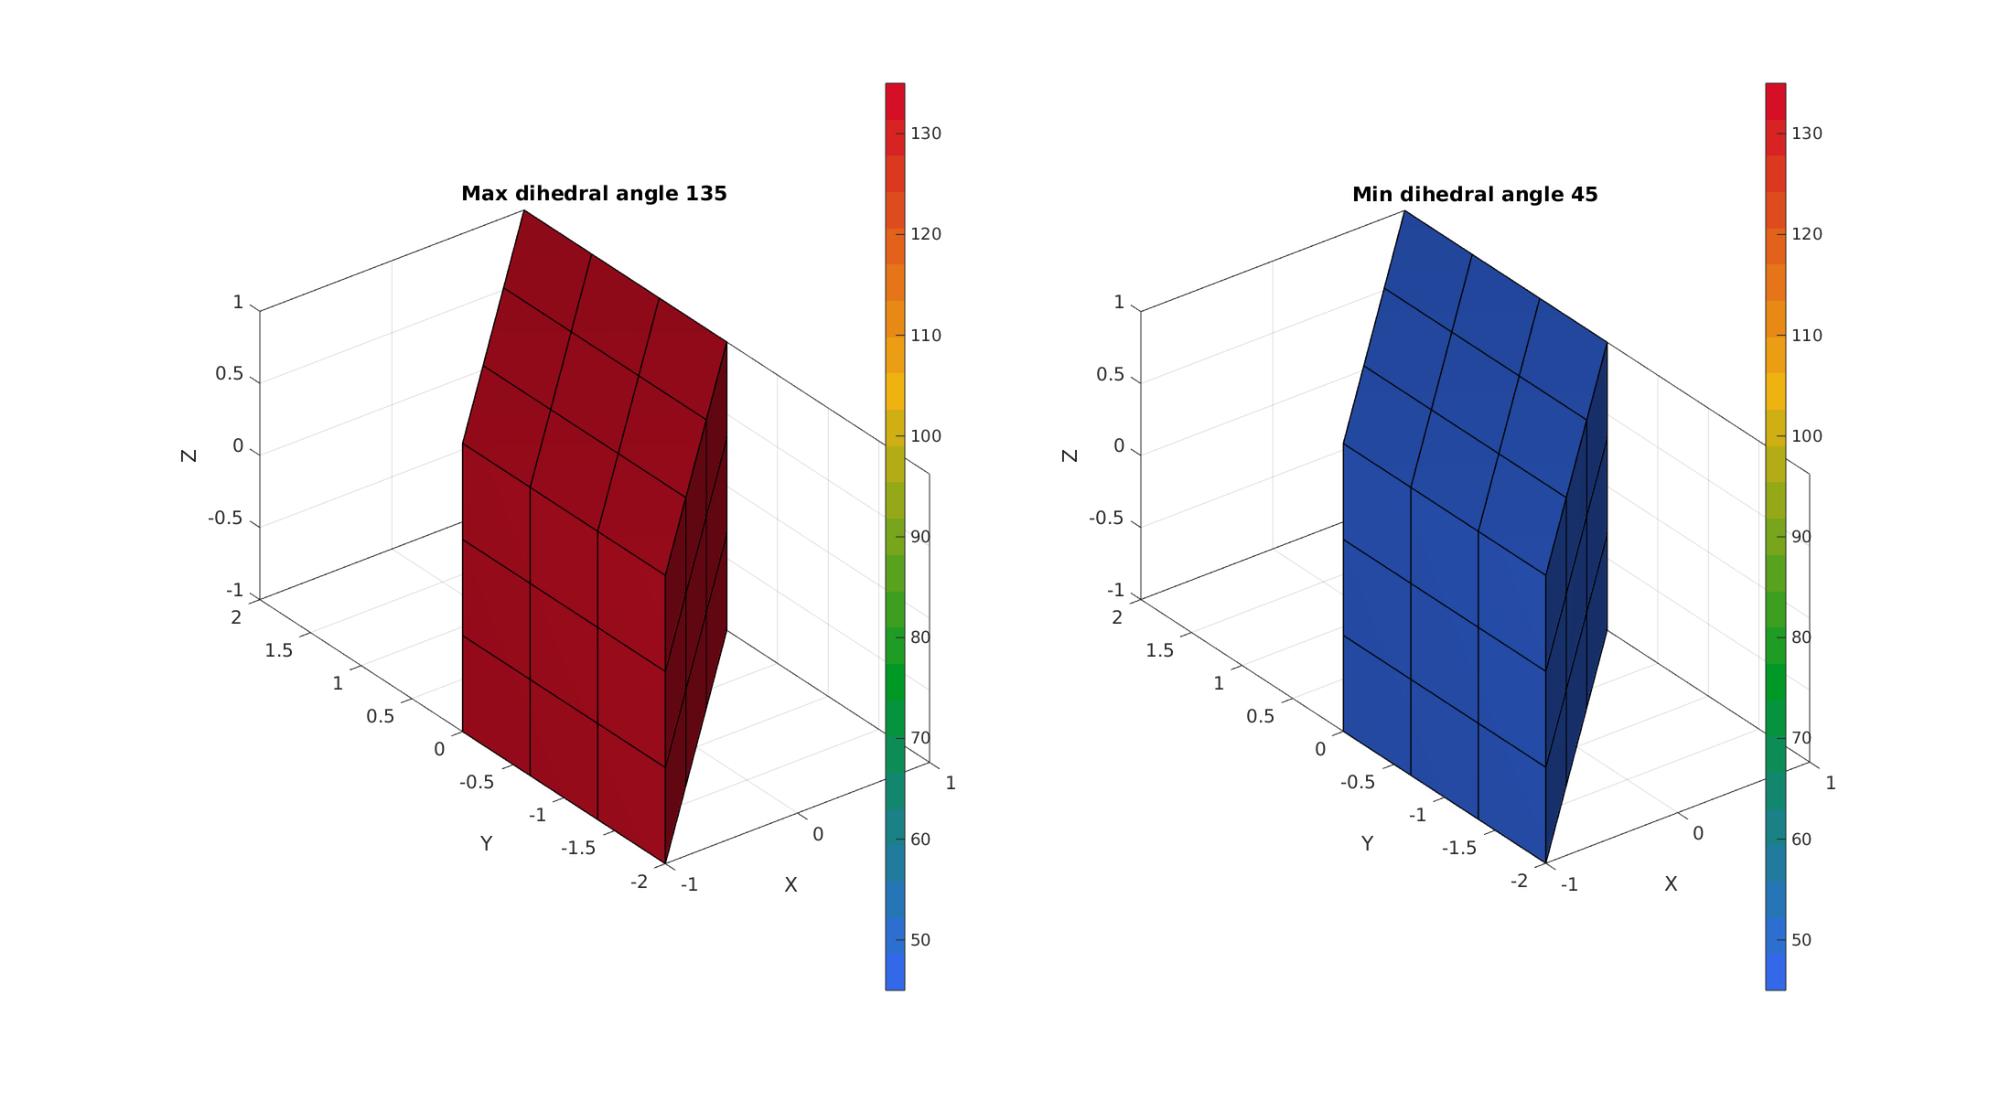
Example 1: Studing dihedral angles for a basic hexahedral mesh
Create mesh for a box
boxDim=2*ones(1,3);
boxEl=3*ones(1,3);
[meshStruct]=hexMeshBox(boxDim,boxEl);
E=meshStruct.E;
V=meshStruct.V;
Deformed into a sheared cube
d=eye(3,3);
d(1,2)=1;
V=V*d;
[A,EE,AE]=dihedralAngles(E,V,'hex8');
A=180*(A./pi);
AE=180*(AE./pi);

A_max=max(A,[],2);
A_min=min(A,[],2);

[F,A_max_F]=element2patch(E,A_max);
[~,A_min_F]=element2patch(E,A_min);
cFigure;
subplot(1,2,1); hold on;
title(['Max dihedral angle ',num2str(max(A_max_F))])
gpatch(F,V,A_max_F,'k',1,1);
axisGeom; camlight headlight;
colormap(gca,gjet(25)); colorbar;
clim([min(A(:)) max(A(:))]);

subplot(1,2,2); hold on;
title(['Min dihedral angle ',num2str(min(A_min_F))])
gpatch(F,V,A_min_F,'k',1,1);
axisGeom; camlight headlight;
colormap(gca,gjet(25)); colorbar;
clim([min(A(:)) max(A(:))]);
gdrawnow;

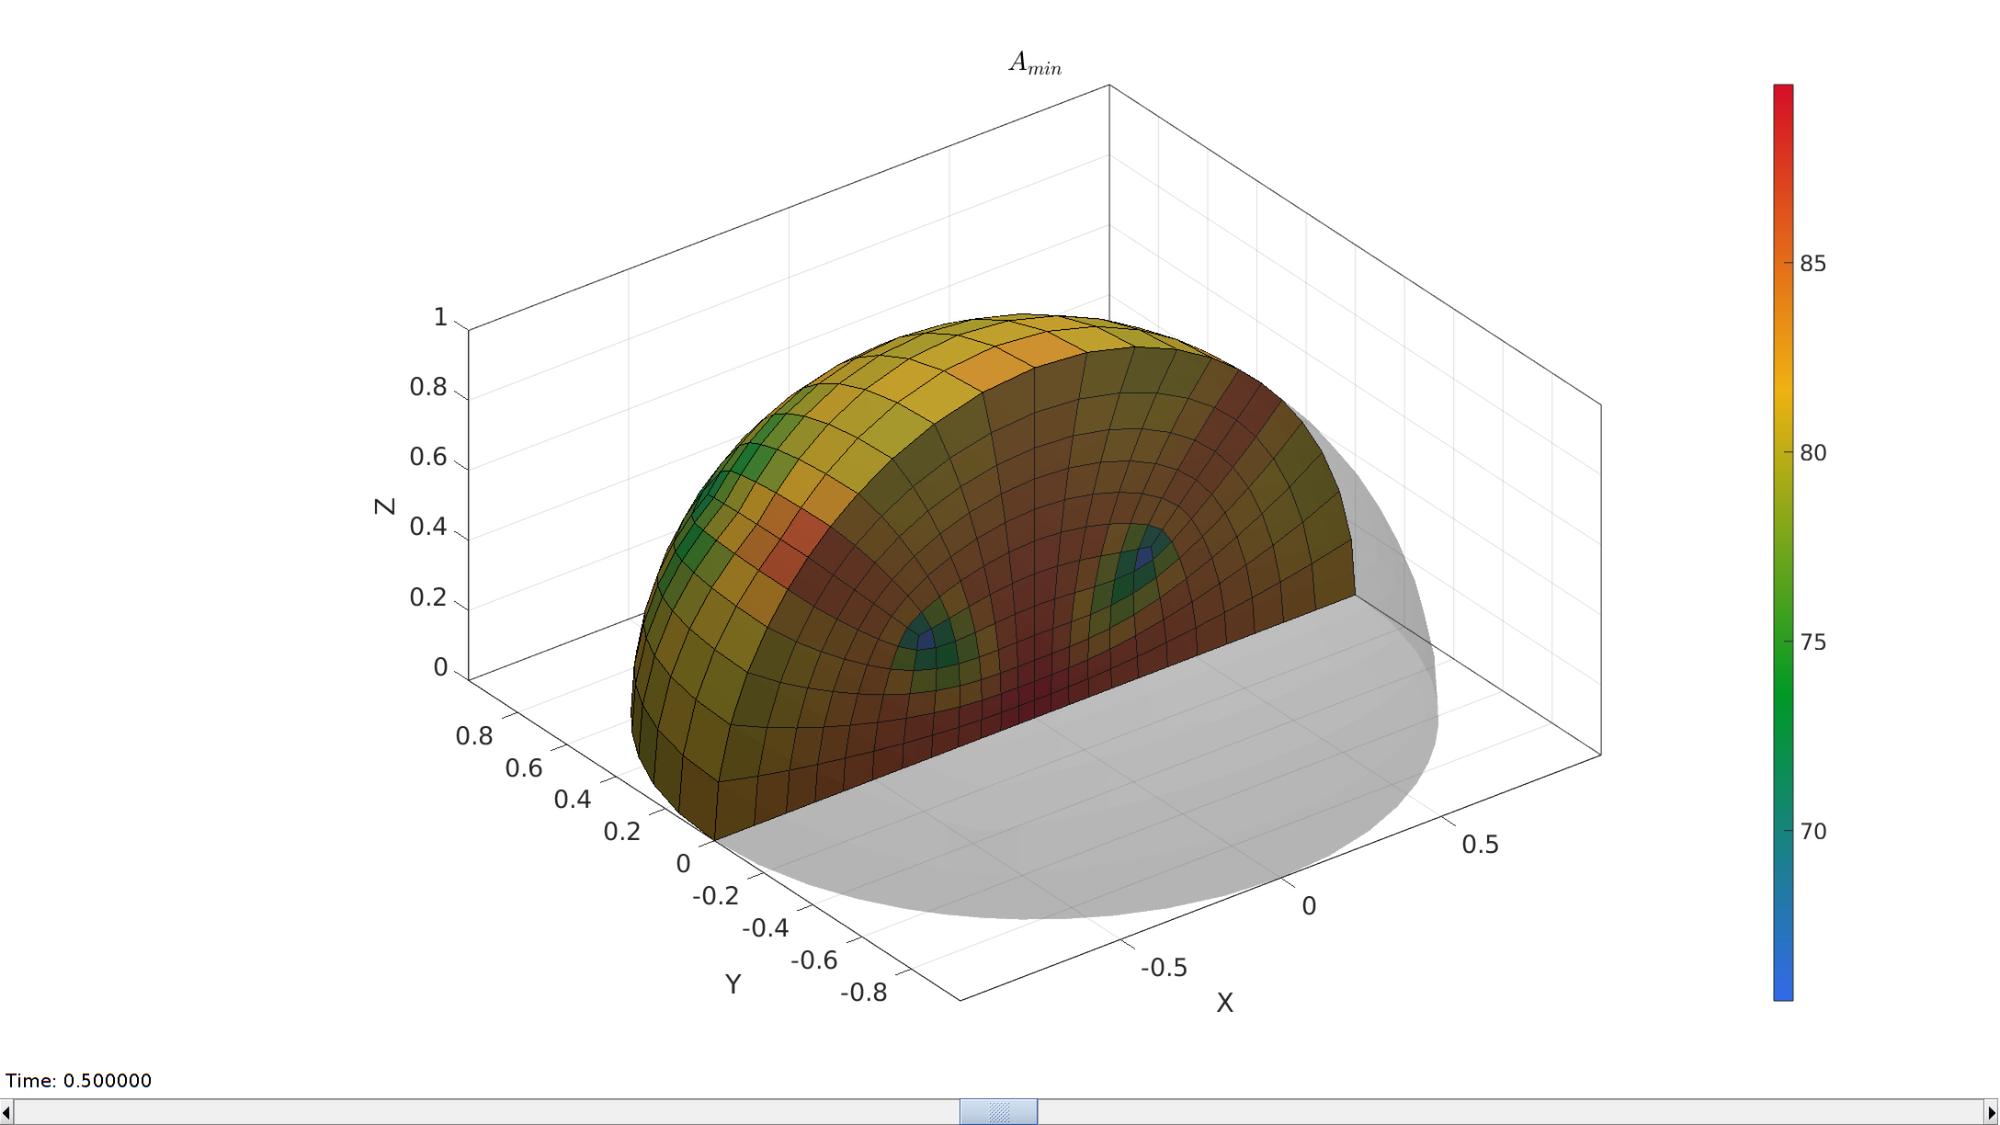
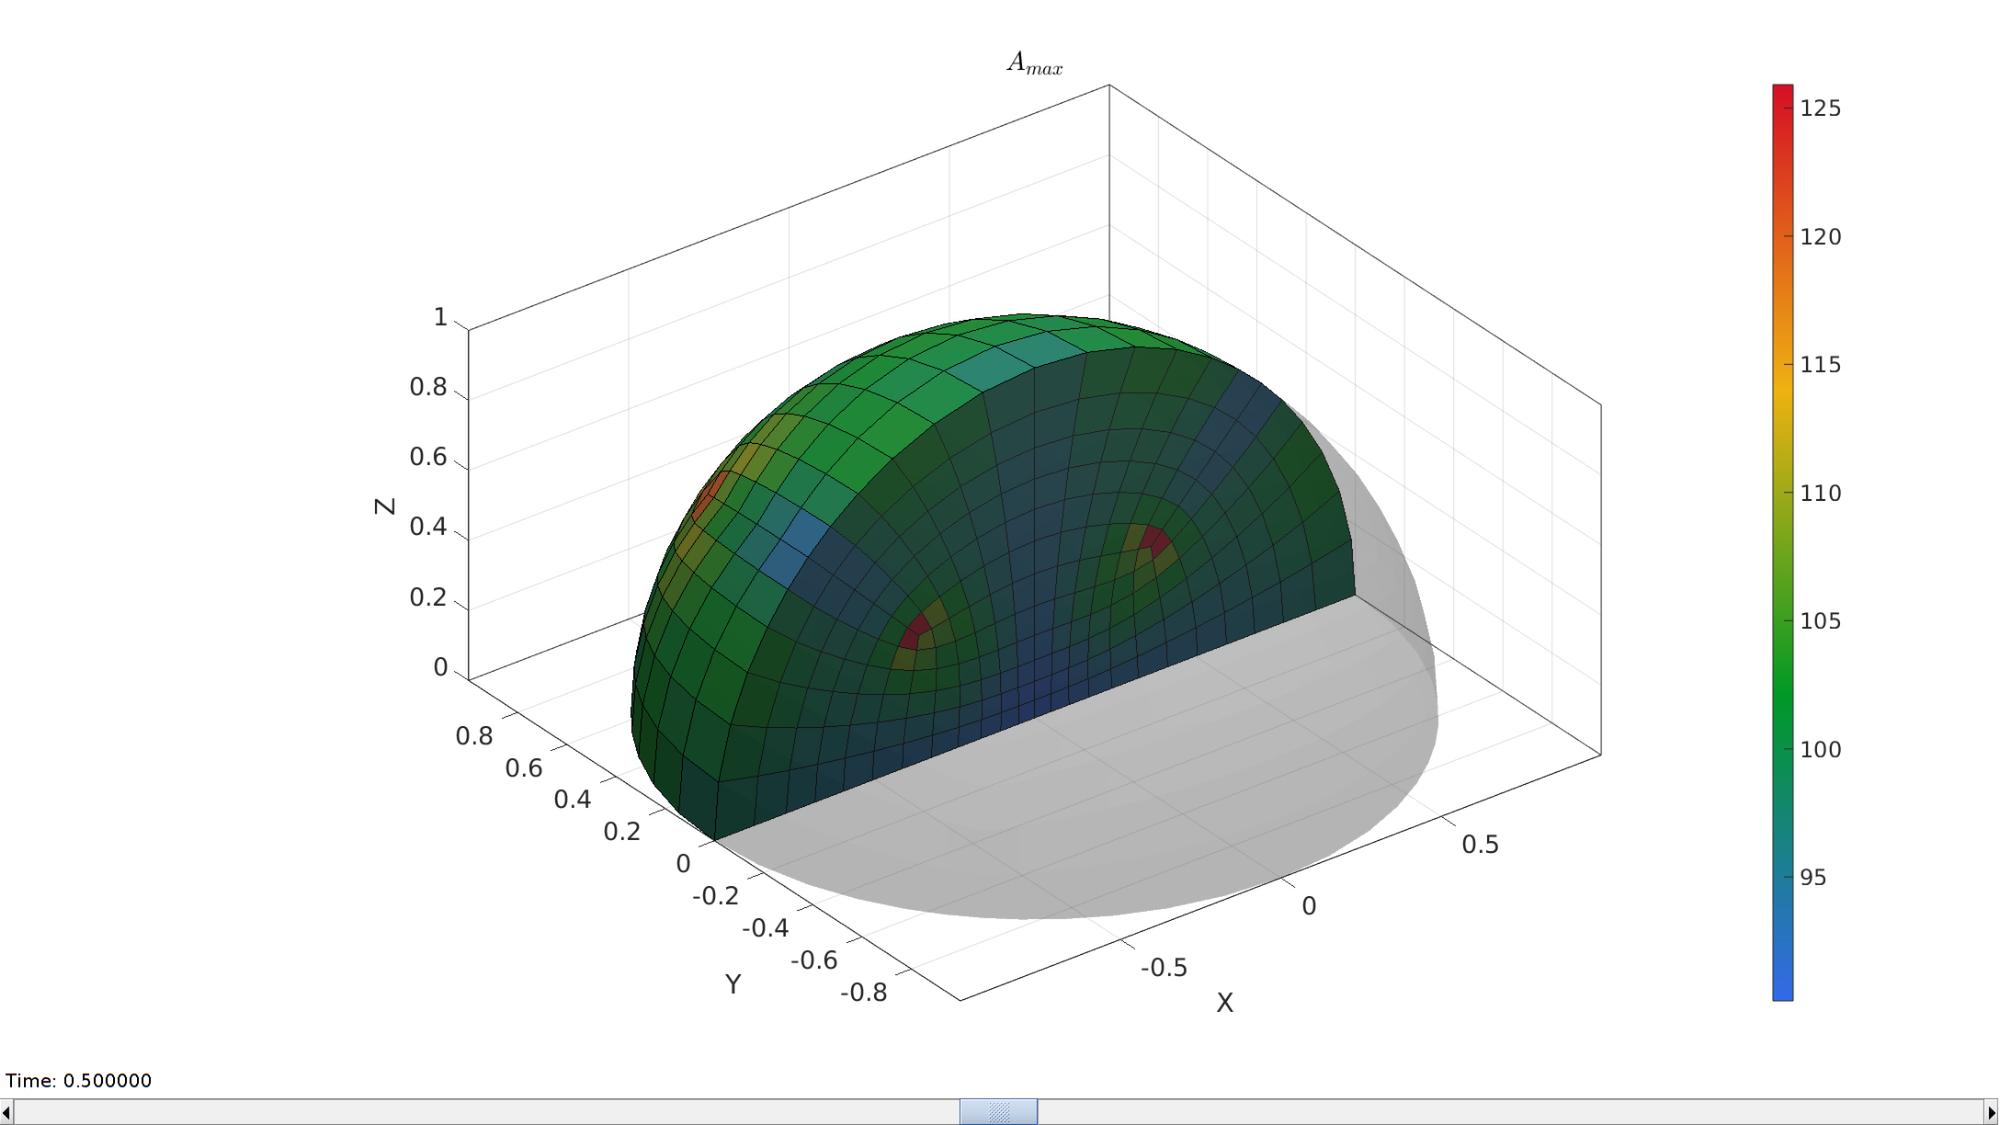
Example 2:
% Creating a  heme-sphere hexahedral mesh

%Control settings
optionStruct.sphereRadius=1;
optionStruct.coreRadius=optionStruct.sphereRadius/2;
optionStruct.numElementsMantel=6;
optionStruct.numElementsCore=optionStruct.numElementsMantel*2;
optionStruct.outputStructType=2;
optionStruct.makeHollow=0;
optionStruct.cParSmooth.n=25;


% %Creating sphere
[meshStruct]=hexMeshHemiSphere(optionStruct);

% Access model element and patch data
Fb=meshStruct.facesBoundary;
Cb=meshStruct.boundaryMarker;
V=meshStruct.nodes;
E=meshStruct.elements;
[A,EE,AE]=dihedralAngles(E,V,'hex8');
A=180*(A./pi);
AE=180*(AE./pi);

A_max=max(A,[],2);
A_min=min(A,[],2);
Visualize mesh
hFig=cFigure; hold on;
title('$A_{min}$','FontSize',fontSize,'Interpreter','latex');

gpatch(Fb,V,'kw','none',0.25); %Boundary as transparent

optionStruct.hFig=hFig;
meshStruct.elementData=A_min;
meshView(meshStruct,optionStruct);
axisGeom(gca,fontSize);
gdrawnow;


hFig=cFigure; hold on;
title('$A_{max}$','FontSize',fontSize,'Interpreter','latex');
gpatch(Fb,V,'kw','none',0.25);

optionStruct.hFig=hFig;
meshStruct.elementData=A_max;
meshView(meshStruct,optionStruct);

axisGeom(gca,fontSize);
drawnow;


GIBBON www.gibboncode.org
Kevin Mattheus Moerman, [email protected]
GIBBON footer text
License: https://github.com/gibbonCode/GIBBON/blob/master/LICENSE
GIBBON: The Geometry and Image-based Bioengineering add-On. A toolbox for image segmentation, image-based modeling, meshing, and finite element analysis.
Copyright (C) 2006-2023 Kevin Mattheus Moerman and the GIBBON contributors
This program is free software: you can redistribute it and/or modify it under the terms of the GNU General Public License as published by the Free Software Foundation, either version 3 of the License, or (at your option) any later version.
This program is distributed in the hope that it will be useful, but WITHOUT ANY WARRANTY; without even the implied warranty of MERCHANTABILITY or FITNESS FOR A PARTICULAR PURPOSE. See the GNU General Public License for more details.
You should have received a copy of the GNU General Public License along with this program. If not, see http://www.gnu.org/licenses/.