evenlySampleCurve
Below is a basic demonstration of the features of the evenlySampleCurve function.
Contents
clear; close all; clc;
Syntax
[Vg] = evenlySampleCurve(V,n,interpPar,closeLoopOpt,spacingFlag);
Description
The evenlySampleCurve function samples a curve evenly in n points. The curve is parameterized using curve distance and can be closed loop if closeLoopOpt==1 (default=0). The resampling is performed using interpolation based on the method specified by interpPar. Available methods are those associated with interp1 i.e.: 'linear', 'nearest', 'next', 'previous', 'spline', 'pchip' (default), 'cubic', and also the custom 'biharmonic' method. Alternatively interpPar my be set as a scalar in the range 0-1 to use the csaps method for cubic spline based smoothening. The 5th input is spacingFlag and defines wether n should be interpretet as number of desired points (0) or as a desired point spacing (1).
The default values for the optional parameters are: n -> size(V,1) interpPar -> 'pchip' closeLoopOpt -> 0 spacingFlag -> 0
See also: interp1, csaps, biharmonicSplineInterpolation
Examples
Plot settings
markerSize1=25;
lineWidth=2;
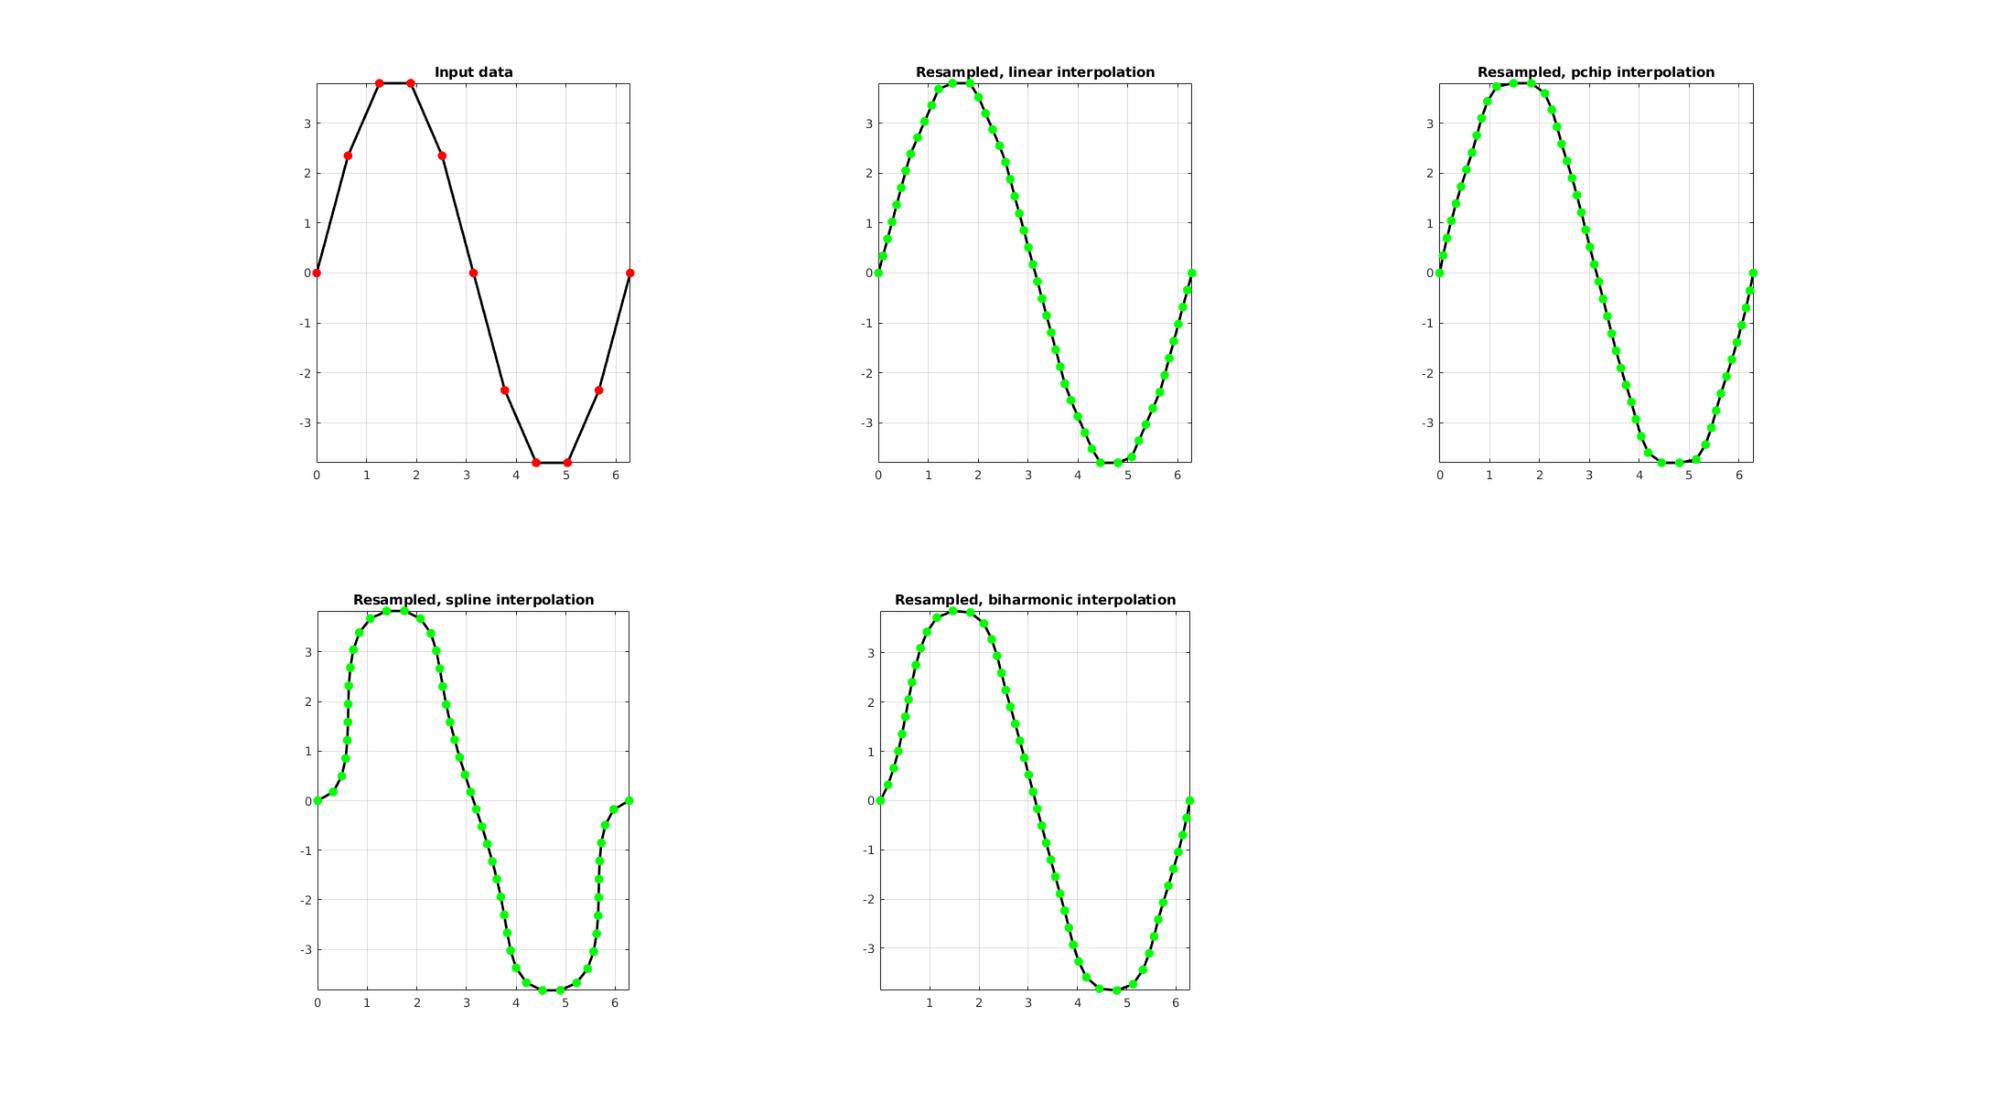
EXAMPLE 1: Evenly sampling a curve
%Simulating the case of an unevenly sampled curve
ns=11;
x=linspace(0,2*pi,ns);
y=4*sin(x);
V=[x(:) y(:)];
Resampling a curve evenly (point spacing based on number of points)
Below the original and resampled curves are shown. Note that the original curve is sampled evenly allong the x-axis but is not evenly sampled allong the curve (point spacing not even) For instance the spacing is smallest in flat regions and lowest in steep regions.Various interpolation methods are shown.
interpMethods={'linear','pchip','spline','biharmonic'};
closeLoopOpt=0; %Option for closed curve
n=50; %New number of points

cFigure;
subplot(2,3,1); hold on;
title('Input data');
plotV(V,'k-','MarkerSize',markerSize1,'lineWidth',lineWidth);
plotV(V,'r.','MarkerSize',markerSize1,'lineWidth',lineWidth);
view(2); grid on; axis equal; axis tight; box on;
drawnow;

for q=1:1:numel(interpMethods)

    [Vg]=evenlySampleCurve(V,n,interpMethods{q},closeLoopOpt);

    subplot(2,3,q+1); hold on;
    title(['Resampled, ',interpMethods{q},' interpolation']);
    plotV(Vg,'k-','MarkerSize',markerSize1,'lineWidth',lineWidth);
    plotV(Vg,'g.','MarkerSize',markerSize1,'lineWidth',lineWidth);
    view(2); grid on; axis equal; axis tight; box on;
end
drawnow;
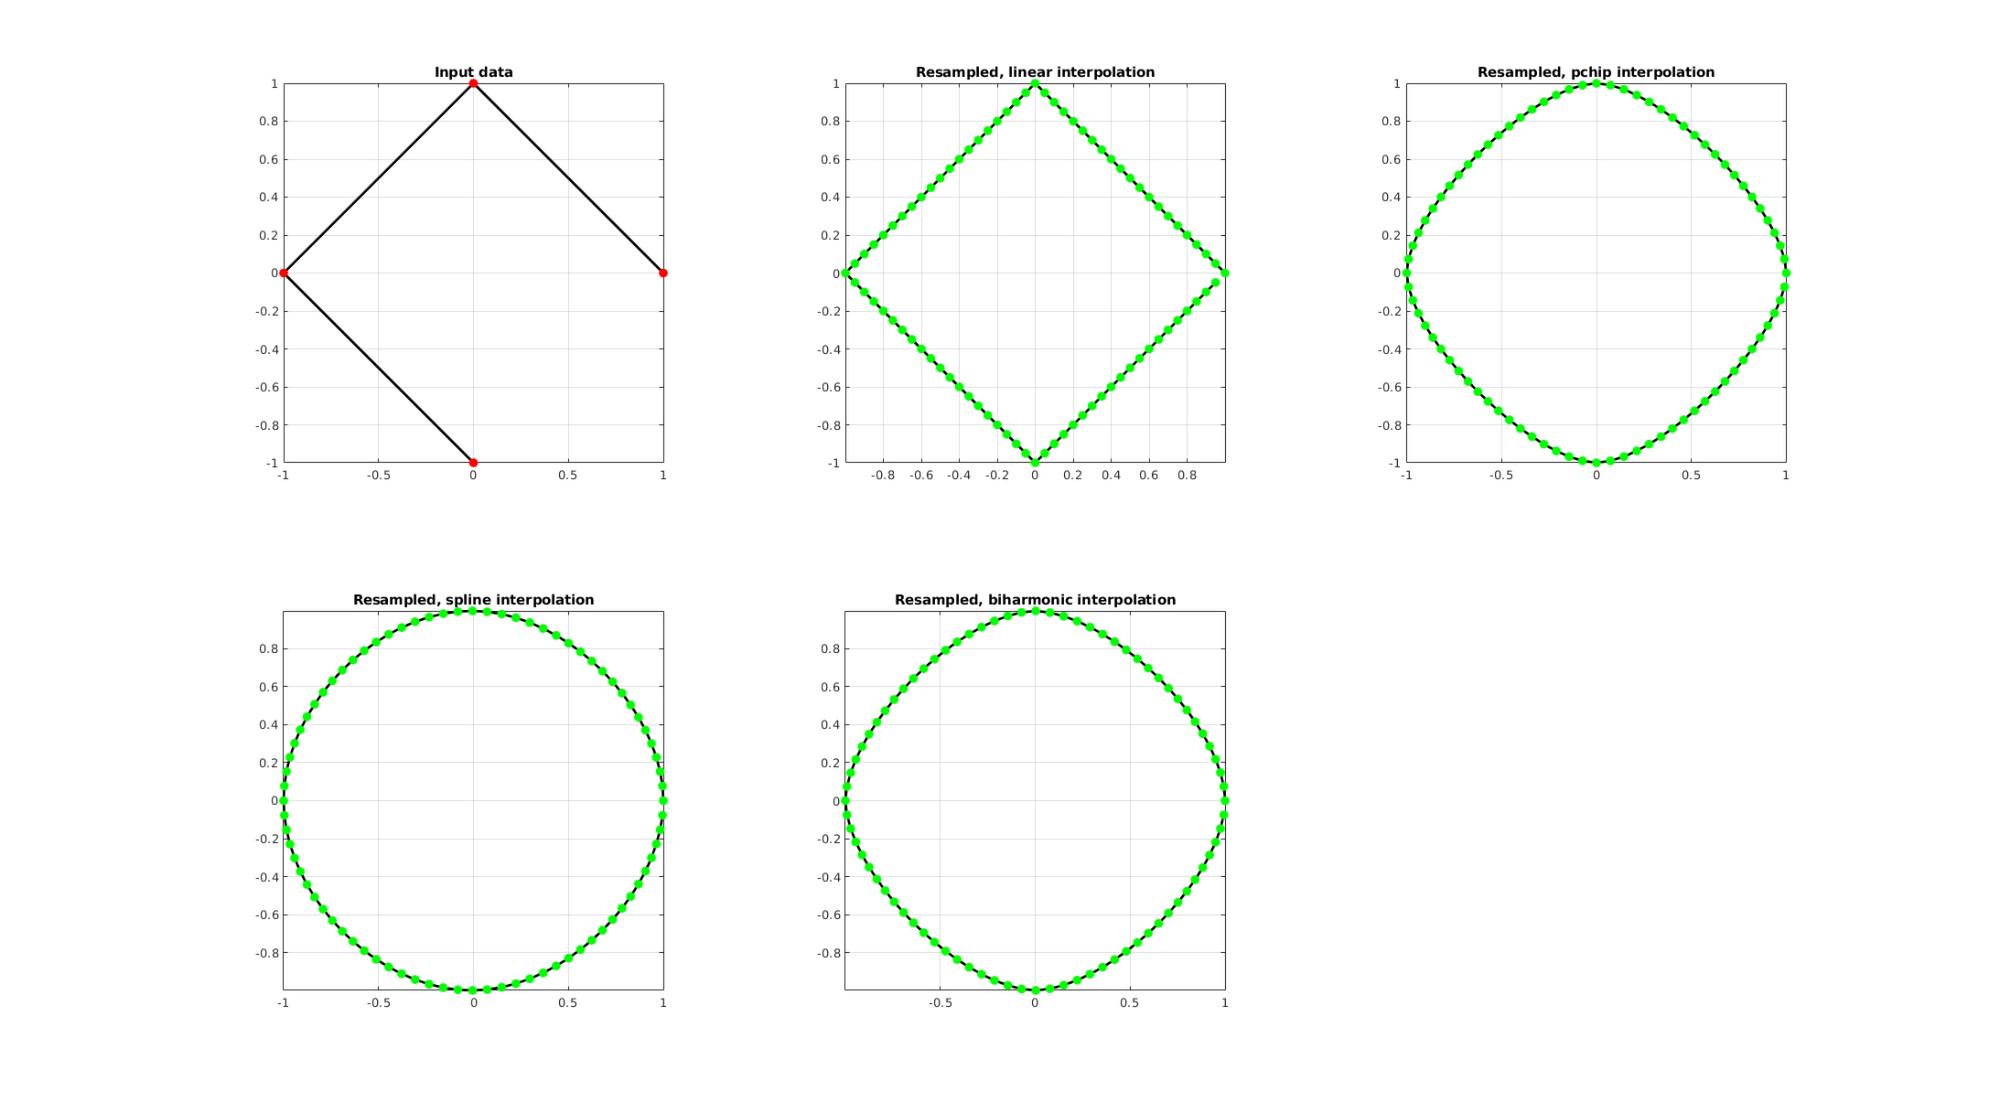
EXAMPLE 2: Upsample a closed polygon
%Simulating the case of an unevenly sampled curve
ns=4;
t=linspace(0,2*pi,ns+1)';
t=t(1:end-1);%+0.25*pi;
V=[cos(t) sin(t)];
Resampling a curve evenly (point spacing based on number of points)
Below the original and resampled curves are shown. Note that the original curve is sampled evenly allong the x-axis but is not evenly sampled allong the curve (point spacing not even) For instance the spacing is smallest in flat regions and lowest in steep regions.Various interpolation methods are shown.
interpMethods={'linear','pchip','spline','biharmonic'};
closeLoopOpt=1; %Option for closed curve
n=ns*20; %New number of points

cFigure;
subplot(2,3,1); hold on;
title('Input data');
plotV(V,'k-','MarkerSize',markerSize1,'lineWidth',lineWidth);
plotV(V,'r.','MarkerSize',markerSize1,'lineWidth',lineWidth);
view(2); grid on; axis equal; axis tight; box on;
drawnow;

for q=1:1:numel(interpMethods)

    [Vg]=evenlySampleCurve(V,n,interpMethods{q},closeLoopOpt);

    subplot(2,3,q+1); hold on;
    title(['Resampled, ',interpMethods{q},' interpolation']);
    plotV(Vg,'k-','MarkerSize',markerSize1,'lineWidth',lineWidth);
    plotV(Vg,'g.','MarkerSize',markerSize1,'lineWidth',lineWidth);
    view(2); grid on; axis equal; axis tight; box on;
end
drawnow;
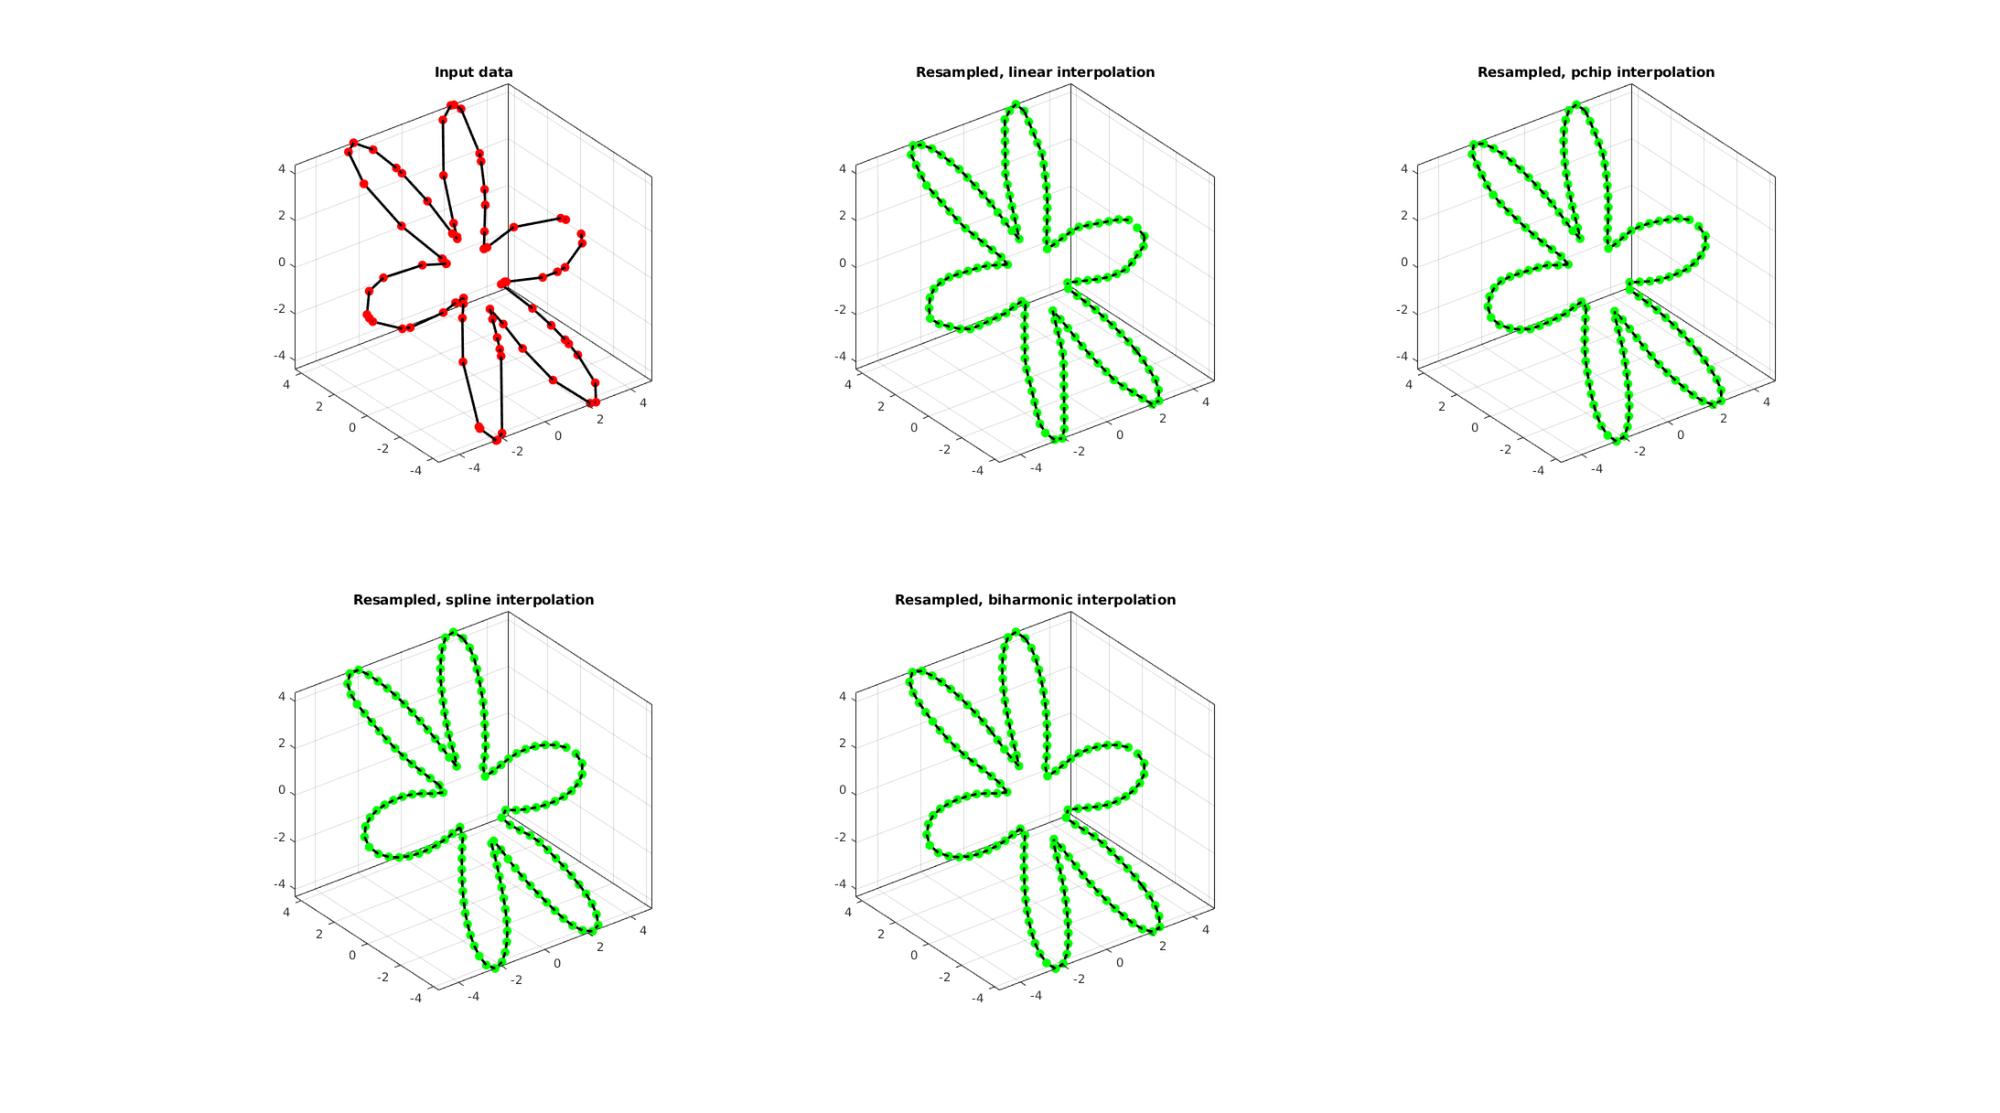
EXAMPLE 3: Evenly sampling a closed curve
%Simulating the case of an unevenly sampled loop curve
ns=75;
t=sort(linspace(0,2*pi,ns)+pi/10*rand(1,ns));
t=unique(t); %removing double points
t=t(t<2*pi);%Removing 2*pi points since they are the same as the 0 point
r=3+2.*cos(6*t);
[x,y] = pol2cart(t,r);
z=y;
V=[x(:) y(:) z(:)];

interpMethod='pchip';
closeLoopOpt=1;
n=200;
[Vg]=evenlySampleCurve(V,n,interpMethod,closeLoopOpt);
Resampling a curve evenly (point spacing based on number of points)
Below the original and resampled curves are shown. Note that the original curve is sampled evenly allong the x-axis but is not evenly sampled allong the curve (point spacing not even) For instance the spacing is smallest in flat regions and lowest in steep regions.Various interpolation methods are shown.
interpMethods={'linear','pchip','spline','biharmonic'};
closeLoopOpt=1; %Option for closed curve
n=ns*2; %New number of points

cFigure;
subplot(2,3,1); hold on;
title('Input data');
plotV(V,'k-','MarkerSize',markerSize1,'lineWidth',lineWidth);
plotV(V,'r.','MarkerSize',markerSize1,'lineWidth',lineWidth);
view(3); grid on; axis equal; axis tight; box on;
drawnow;

for q=1:1:numel(interpMethods)

    [Vg]=evenlySampleCurve(V,n,interpMethods{q},closeLoopOpt);

    subplot(2,3,q+1); hold on;
    title(['Resampled, ',interpMethods{q},' interpolation']);
    plotV(Vg,'k-','MarkerSize',markerSize1,'lineWidth',lineWidth);
    plotV(Vg,'g.','MarkerSize',markerSize1,'lineWidth',lineWidth);
    view(3); grid on; axis equal; axis tight; box on;
end
drawnow;
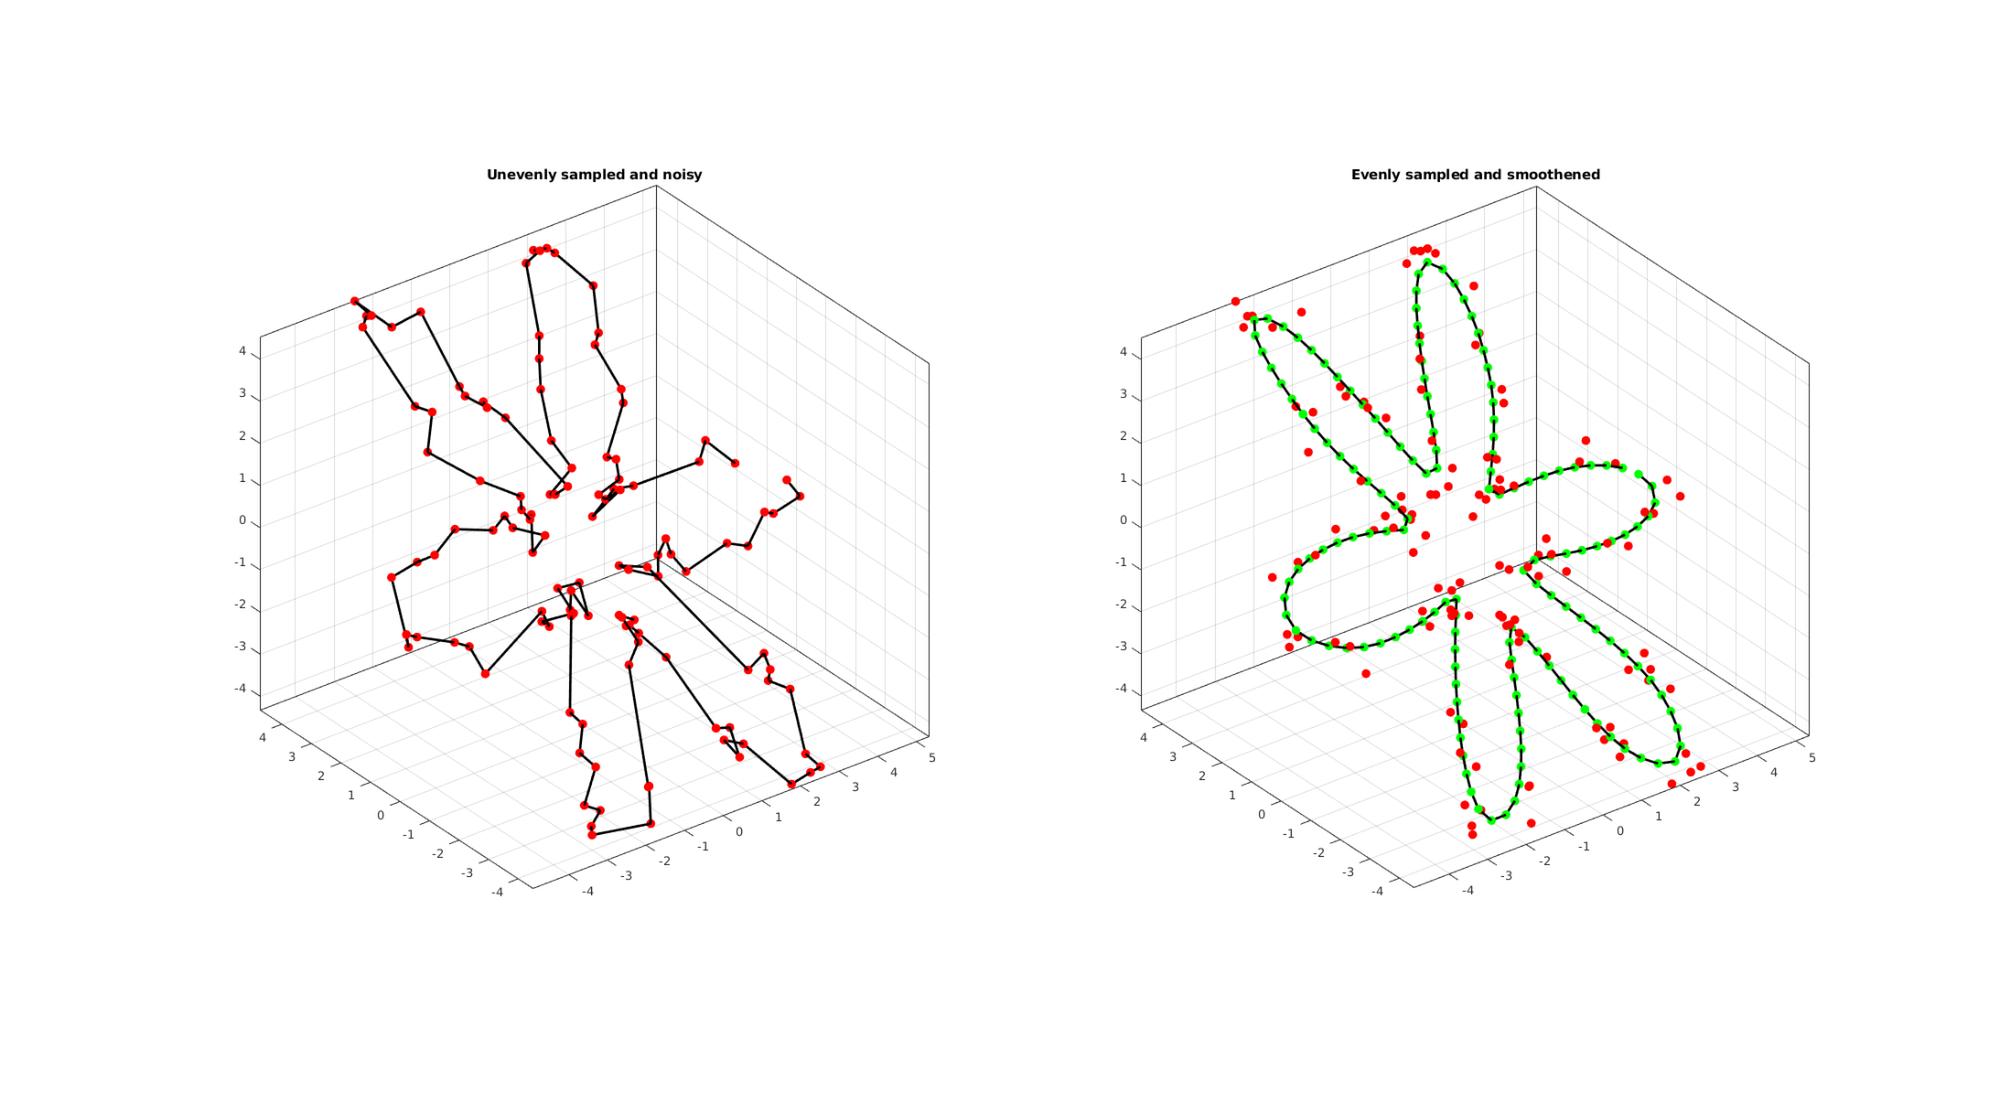
EXAMPLE 4: Resampling and smoothening a curve based on CSAPS
By setting interpMethod as a scalar between 0 and 1 it is interpreted as a smoothening parameter for csaps based cubic smoothening.
ns=125;
t=sort(linspace(0,2*pi,ns)+pi/10*rand(1,ns));
t=unique(t); %removing double points
t=t(t<2*pi);%Removing 2*pi points since they are the same as the 0 point
r=3+2.*cos(6*t);
[x,y] = pol2cart(t,r);
z=y;
V=[x(:) y(:) z(:)];

%Adding noise
V=V+0.2.*randn(size(V));

interpMethod=0.25; %Setting a scaler triggers csaps based smoothening
closeLoopOpt=1;
[Vg]=evenlySampleCurve(V,n,interpMethod,closeLoopOpt);

cFigure;
subplot(1,2,1); hold on;
title('Unevenly sampled and noisy');
plotV(V,'k-','MarkerSize',markerSize1,'lineWidth',lineWidth);
plotV(V,'r.','MarkerSize',markerSize1,'lineWidth',lineWidth);
view(3); grid on; axis equal; axis tight;  box on;
subplot(1,2,2); hold on;
title('Evenly sampled and smoothened');
plotV(Vg,'k-','MarkerSize',markerSize1,'lineWidth',lineWidth);
plotV(Vg,'g.','MarkerSize',markerSize1,'lineWidth',lineWidth);
plotV(V,'r.','MarkerSize',markerSize1);
view(3); grid on; axis equal; axis tight;  box on;
drawnow;
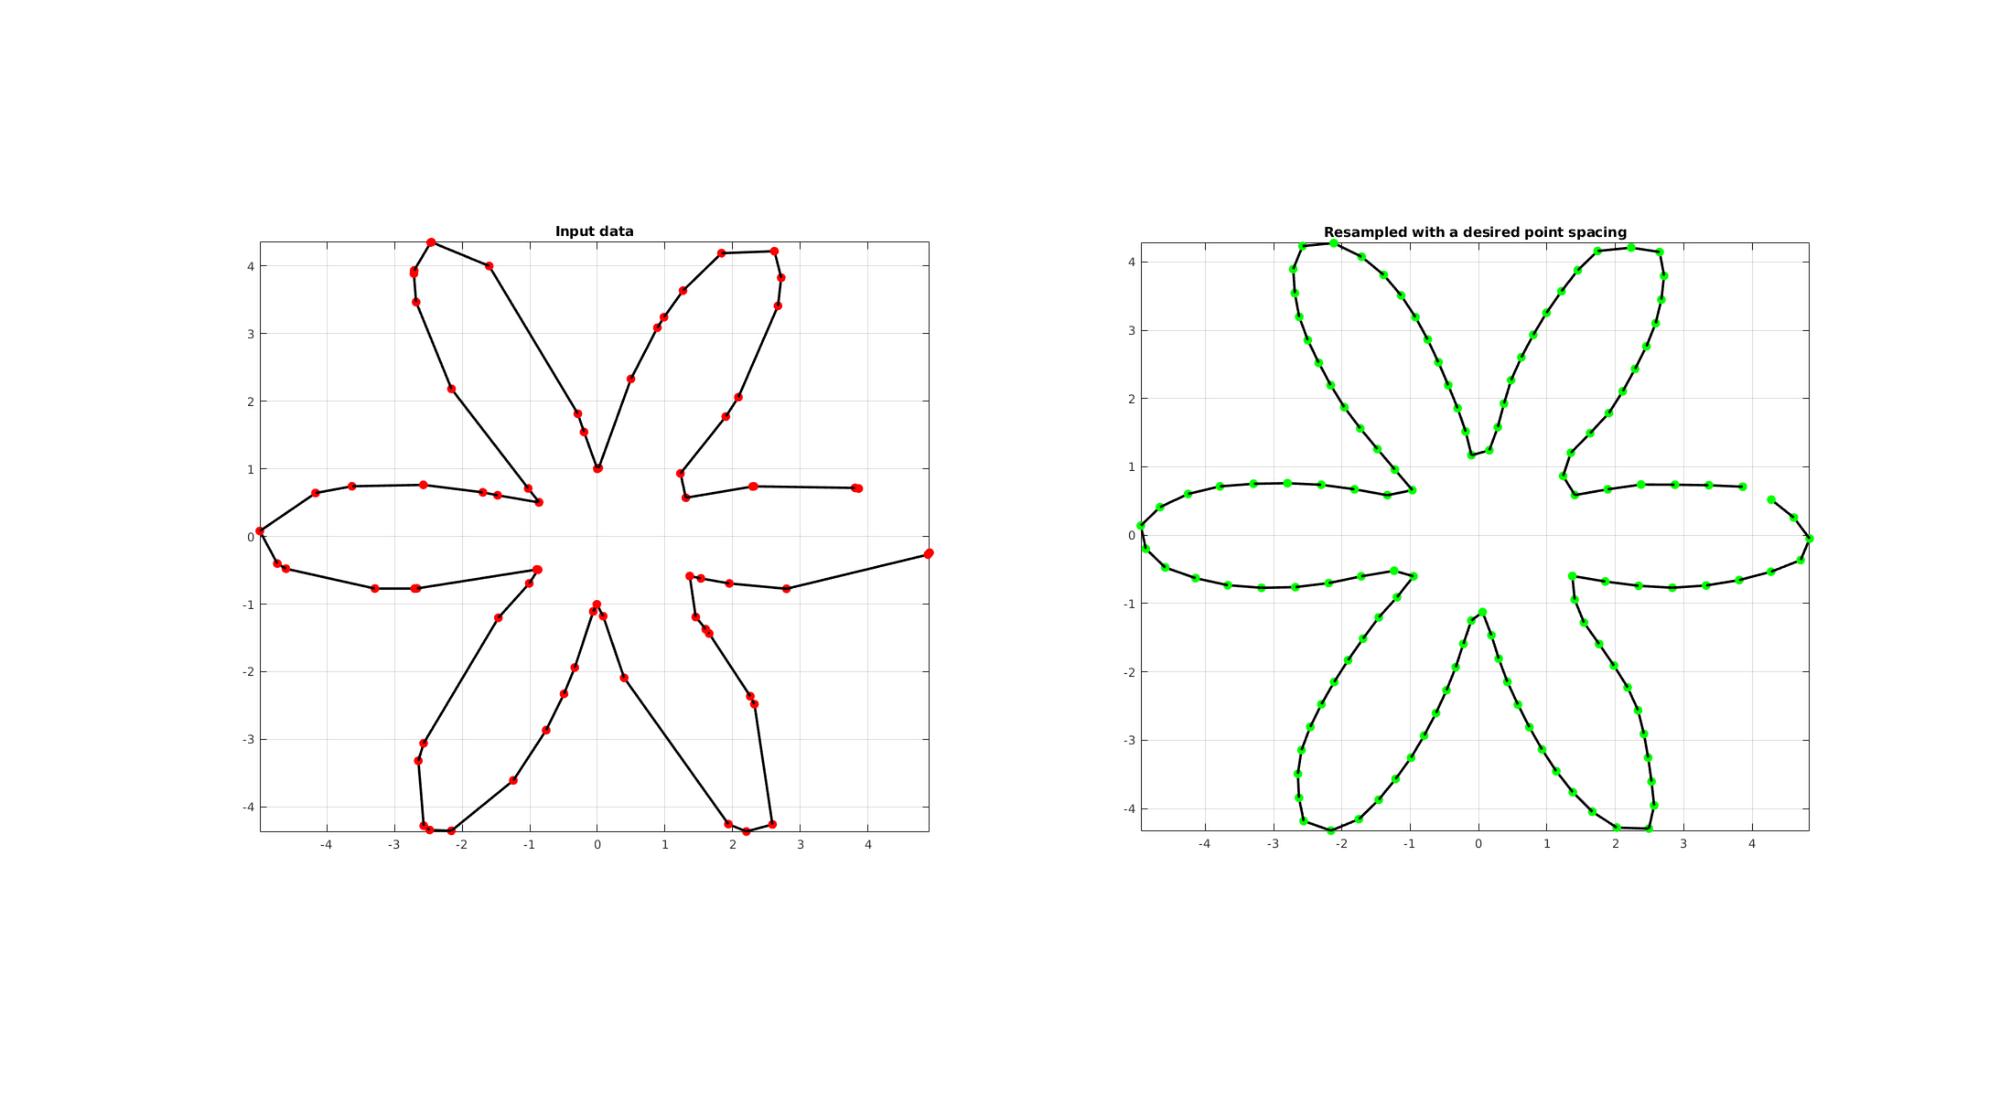
EXAMPLE 5: Using point spacing instead of number of points
If the spacingFlag value is set to true (or 1) then the second input is instead interpretet as the desired point spacing.
ns=75;
t=sort(linspace(0,2*pi,ns)+pi/10*rand(1,ns));
t=unique(t); %removing double points
t=t(t<2*pi);%Removing 2*pi points since they are the same as the 0 point
r=3+2.*cos(6*t);
[x,y] = pol2cart(t,r);
z=y;
V=[x(:) y(:) z(:)];

interpMethod='pchip';
closeLoopOpt=1;
spacingFlag=1;
pointSpacing=0.5;
[Vg]=evenlySampleCurve(V,pointSpacing,interpMethod,closeLoopOpt,spacingFlag);

cFigure;
subplot(1,2,1); hold on;
title('Input data');
plotV(V,'k-','MarkerSize',markerSize1,'lineWidth',lineWidth);
plotV(V,'r.','MarkerSize',markerSize1,'lineWidth',lineWidth);
view(2); grid on; axis equal; axis tight; box on;
drawnow;

subplot(1,2,2); hold on;
title('Resampled with a desired point spacing');
plotV(Vg,'k-','MarkerSize',markerSize1,'lineWidth',lineWidth);
plotV(Vg,'g.','MarkerSize',markerSize1,'lineWidth',lineWidth);
view(2); grid on; axis equal; axis tight; box on;

drawnow;

GIBBON www.gibboncode.org
Kevin Mattheus Moerman, gibbon.toolbox@gmail.com
GIBBON footer text
License: https://github.com/gibbonCode/GIBBON/blob/master/LICENSE
GIBBON: The Geometry and Image-based Bioengineering add-On. A toolbox for image segmentation, image-based modeling, meshing, and finite element analysis.
Copyright (C) 2019 Kevin Mattheus Moerman
This program is free software: you can redistribute it and/or modify it under the terms of the GNU General Public License as published by the Free Software Foundation, either version 3 of the License, or (at your option) any later version.
This program is distributed in the hope that it will be useful, but WITHOUT ANY WARRANTY; without even the implied warranty of MERCHANTABILITY or FITNESS FOR A PARTICULAR PURPOSE. See the GNU General Public License for more details.
You should have received a copy of the GNU General Public License along with this program. If not, see http://www.gnu.org/licenses/.