hexVol
Below is a demonstration of the features of the hexVol function
Contents
clear; close all; clc;
Syntax
[VE,L]=hexVol(E,V,absOpt);
Description
This function computes hexahedral element volumes. The input is the element description (E) and the nodes (V). The output is the element volumes (always positive) and a logic denoting wheter the element appears to be valid (1) or inverted (0).
Example: Computing the volume of hexahedral elements
Creating example geometry for a beam
boxDim=[6 4 4]; %Box dimensions
boxEl=[5 3 3]; %Number of elements in each direction
[meshStruct]=hexMeshBox(boxDim,boxEl);

E=meshStruct.E;
V=meshStruct.V;
F=meshStruct.F;
Fb=meshStruct.Fb;
Computing the volume
[VE]=hexVol(E,V)
VE =

    2.1333
    2.1333
    2.1333
    2.1333
    2.1333
    2.1333
    2.1333
    2.1333
    2.1333
    2.1333
    2.1333
    2.1333
    2.1333
    2.1333
    2.1333
    2.1333
    2.1333
    2.1333
    2.1333
    2.1333
    2.1333
    2.1333
    2.1333
    2.1333
    2.1333
    2.1333
    2.1333
    2.1333
    2.1333
    2.1333
    2.1333
    2.1333
    2.1333
    2.1333
    2.1333
    2.1333
    2.1333
    2.1333
    2.1333
    2.1333
    2.1333
    2.1333
    2.1333
    2.1333
    2.1333
The summed volume should match the theoretical
volume_theoretical=prod(boxDim);
volume_total=sum(VE);

disp(['Theoretical volume:',sprintf('%f',volume_theoretical)]);
disp(['Total volume computed:',sprintf('%f',volume_total)]);
Theoretical volume:96.000000
Total volume computed:96.000000
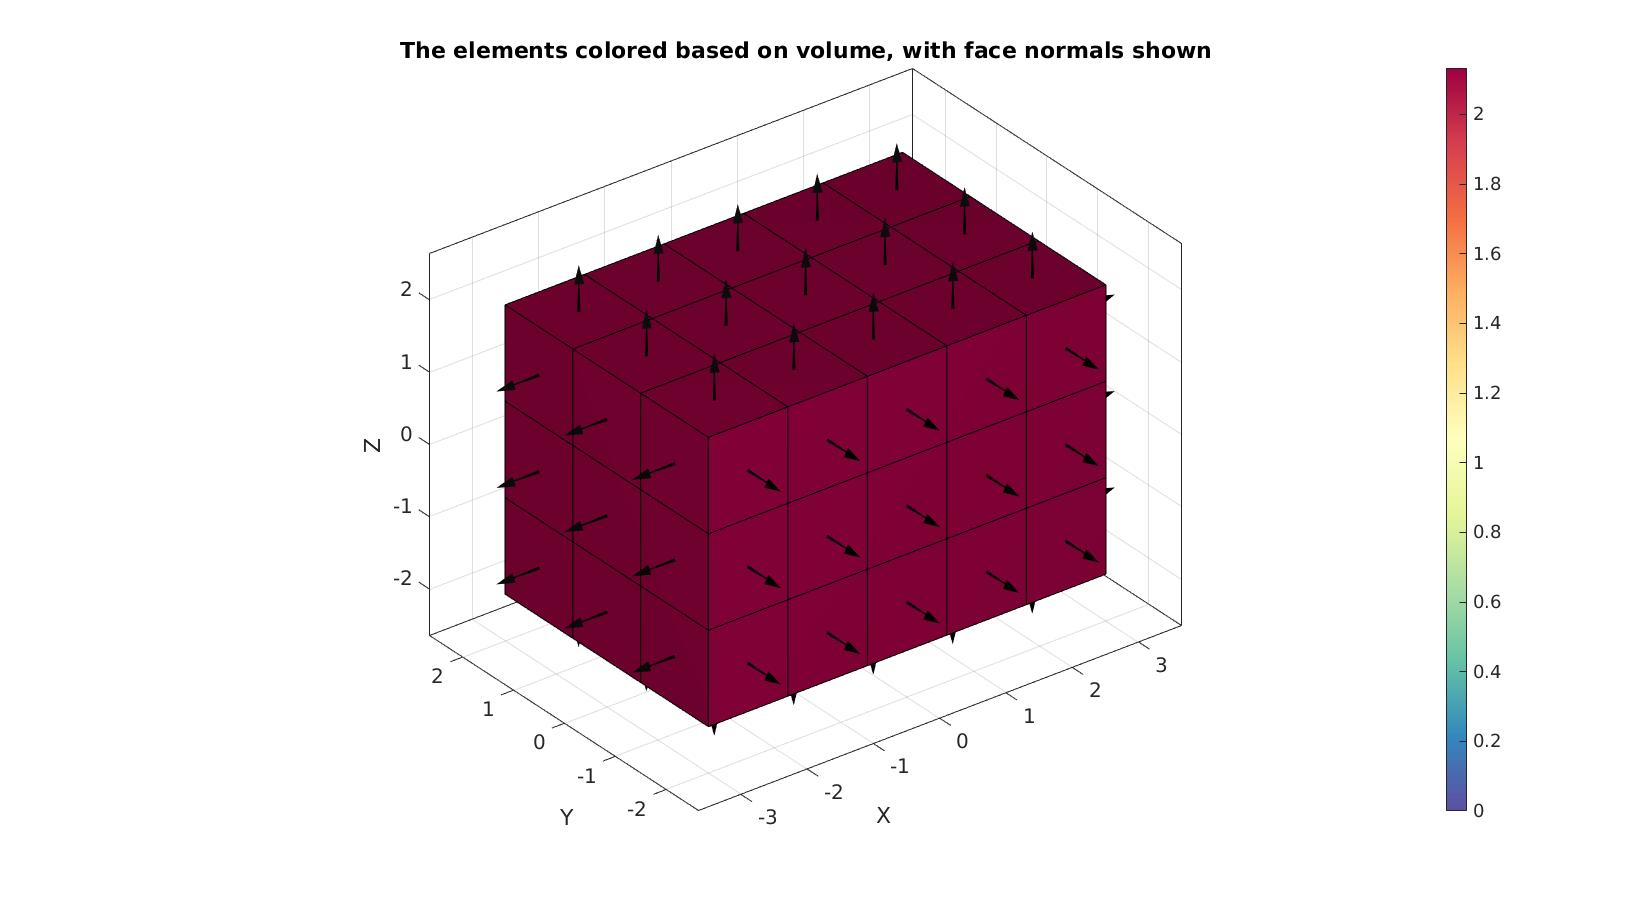
Visualize mesh and face normals
%Create patch data for plotting
[F,C]=element2patch(E,VE);

cFigure; hold on;
title('The elements colored based on volume, with face normals shown')
gpatch(F,V,C,'k',1);
patchNormPlot(F,V);
axisGeom; camlight headlight;
colormap spectral; colorbar;
caxis([0 max(VE)]);
drawnow;

Example: Handling negative volumes
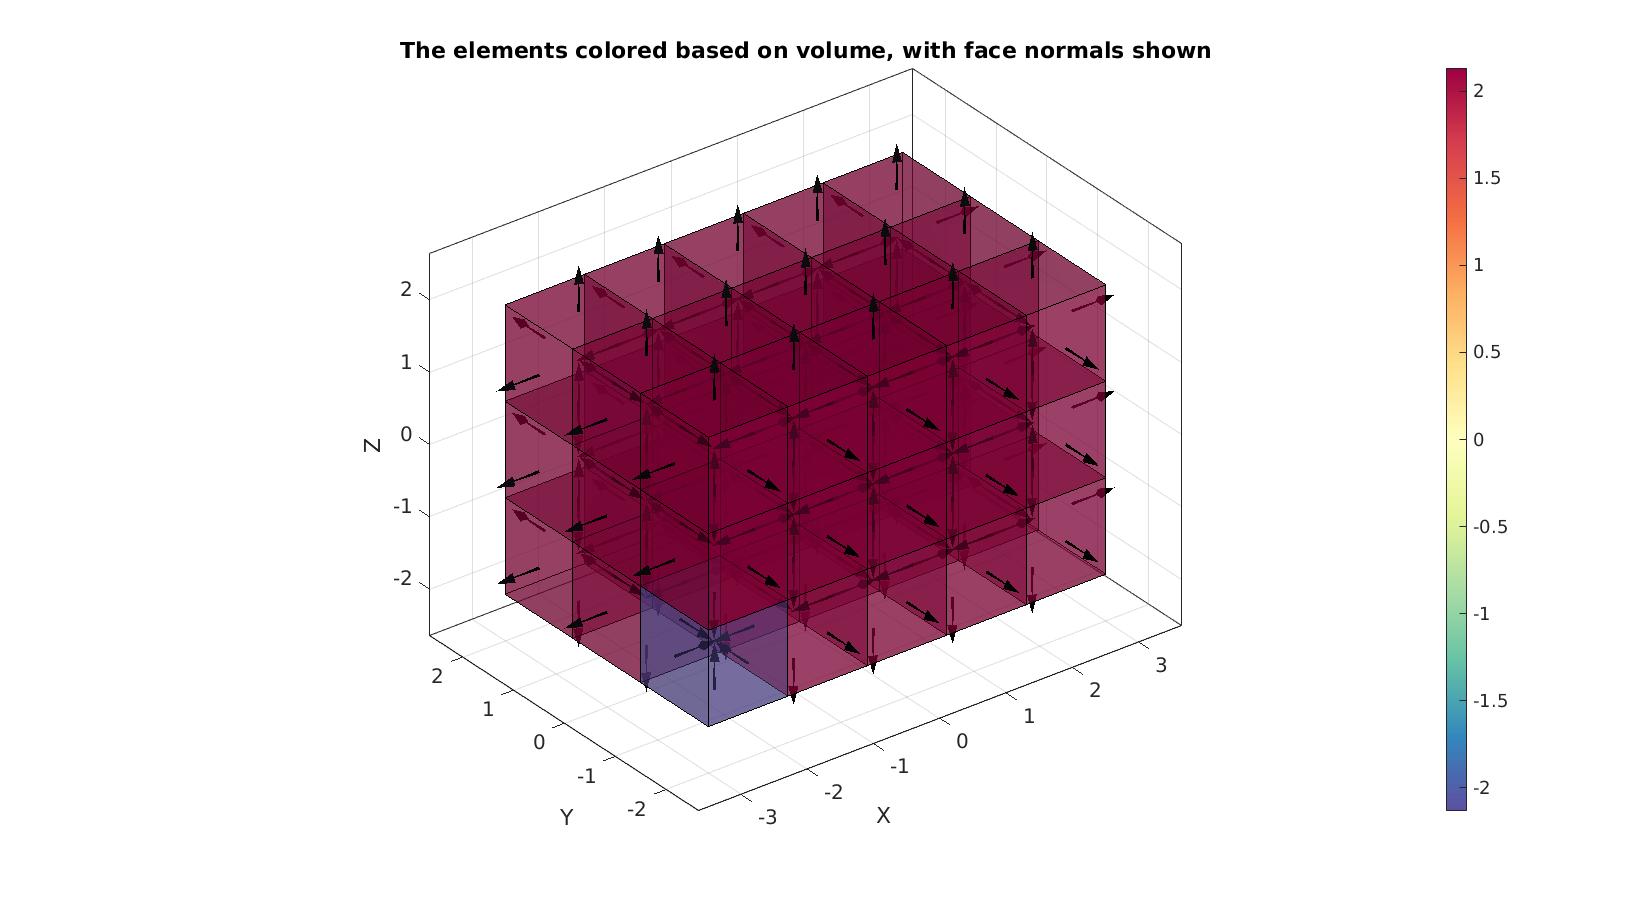
Volumes are made absolute by default. To help detect inverted elements the optional input absOpt can be set to 0 to allow for negative volume output. In addition an output logicPositive can be requested which is true for postive volumes and false for negative volumes.
E_inverted=E; %Copy element set
E_inverted(1,:)=E_inverted(1,[5:8 1:4]); %Invert first element

%Inspect element volumes and logic
absOpt=1 %Output absolute volumes
[VE,logicPositive]=hexVol(E_inverted,V,absOpt)

absOpt=0 %Output may include negative volumes
[VE,logicPositive]=hexVol(E_inverted,V,absOpt)
absOpt =

     1


VE =

    2.1333
    2.1333
    2.1333
    2.1333
    2.1333
    2.1333
    2.1333
    2.1333
    2.1333
    2.1333
    2.1333
    2.1333
    2.1333
    2.1333
    2.1333
    2.1333
    2.1333
    2.1333
    2.1333
    2.1333
    2.1333
    2.1333
    2.1333
    2.1333
    2.1333
    2.1333
    2.1333
    2.1333
    2.1333
    2.1333
    2.1333
    2.1333
    2.1333
    2.1333
    2.1333
    2.1333
    2.1333
    2.1333
    2.1333
    2.1333
    2.1333
    2.1333
    2.1333
    2.1333
    2.1333


logicPositive =

  45×1 logical array

   0
   1
   1
   1
   1
   1
   1
   1
   1
   1
   1
   1
   1
   1
   1
   1
   1
   1
   1
   1
   1
   1
   1
   1
   1
   1
   1
   1
   1
   1
   1
   1
   1
   1
   1
   1
   1
   1
   1
   1
   1
   1
   1
   1
   1


absOpt =

     0


VE =

   -2.1333
    2.1333
    2.1333
    2.1333
    2.1333
    2.1333
    2.1333
    2.1333
    2.1333
    2.1333
    2.1333
    2.1333
    2.1333
    2.1333
    2.1333
    2.1333
    2.1333
    2.1333
    2.1333
    2.1333
    2.1333
    2.1333
    2.1333
    2.1333
    2.1333
    2.1333
    2.1333
    2.1333
    2.1333
    2.1333
    2.1333
    2.1333
    2.1333
    2.1333
    2.1333
    2.1333
    2.1333
    2.1333
    2.1333
    2.1333
    2.1333
    2.1333
    2.1333
    2.1333
    2.1333


logicPositive =

  45×1 logical array

   0
   1
   1
   1
   1
   1
   1
   1
   1
   1
   1
   1
   1
   1
   1
   1
   1
   1
   1
   1
   1
   1
   1
   1
   1
   1
   1
   1
   1
   1
   1
   1
   1
   1
   1
   1
   1
   1
   1
   1
   1
   1
   1
   1
   1
Visualize mesh and face normals
%Create patch data for plotting
[F,C]=element2patch(E_inverted,VE);

cFigure; hold on;
title('The elements colored based on volume, with face normals shown')
gpatch(F,V,C,'k',0.5);
patchNormPlot(F,V);
axisGeom; camlight headlight;
colormap spectral; colorbar;
caxis([min(VE) max(VE)]);
drawnow;

Example: A more complex hex mesh
%Control settings
optionStruct.sphereRadius=10;
optionStruct.coreRadius=5;
optionStruct.numElementsMantel=5;
optionStruct.numElementsCore=8;
optionStruct.makeHollow=0;
optionStruct.outputStructType=2;

%Creating sphere
[meshStruct]=hexMeshSphere(optionStruct);

% Access model element and patch data
Fb=meshStruct.facesBoundary;
Cb=meshStruct.boundaryMarker;
V=meshStruct.nodes;
E=meshStruct.elements;

absOpt=0; %Output may include negative volumes
VE=hexVol(E,V,absOpt);
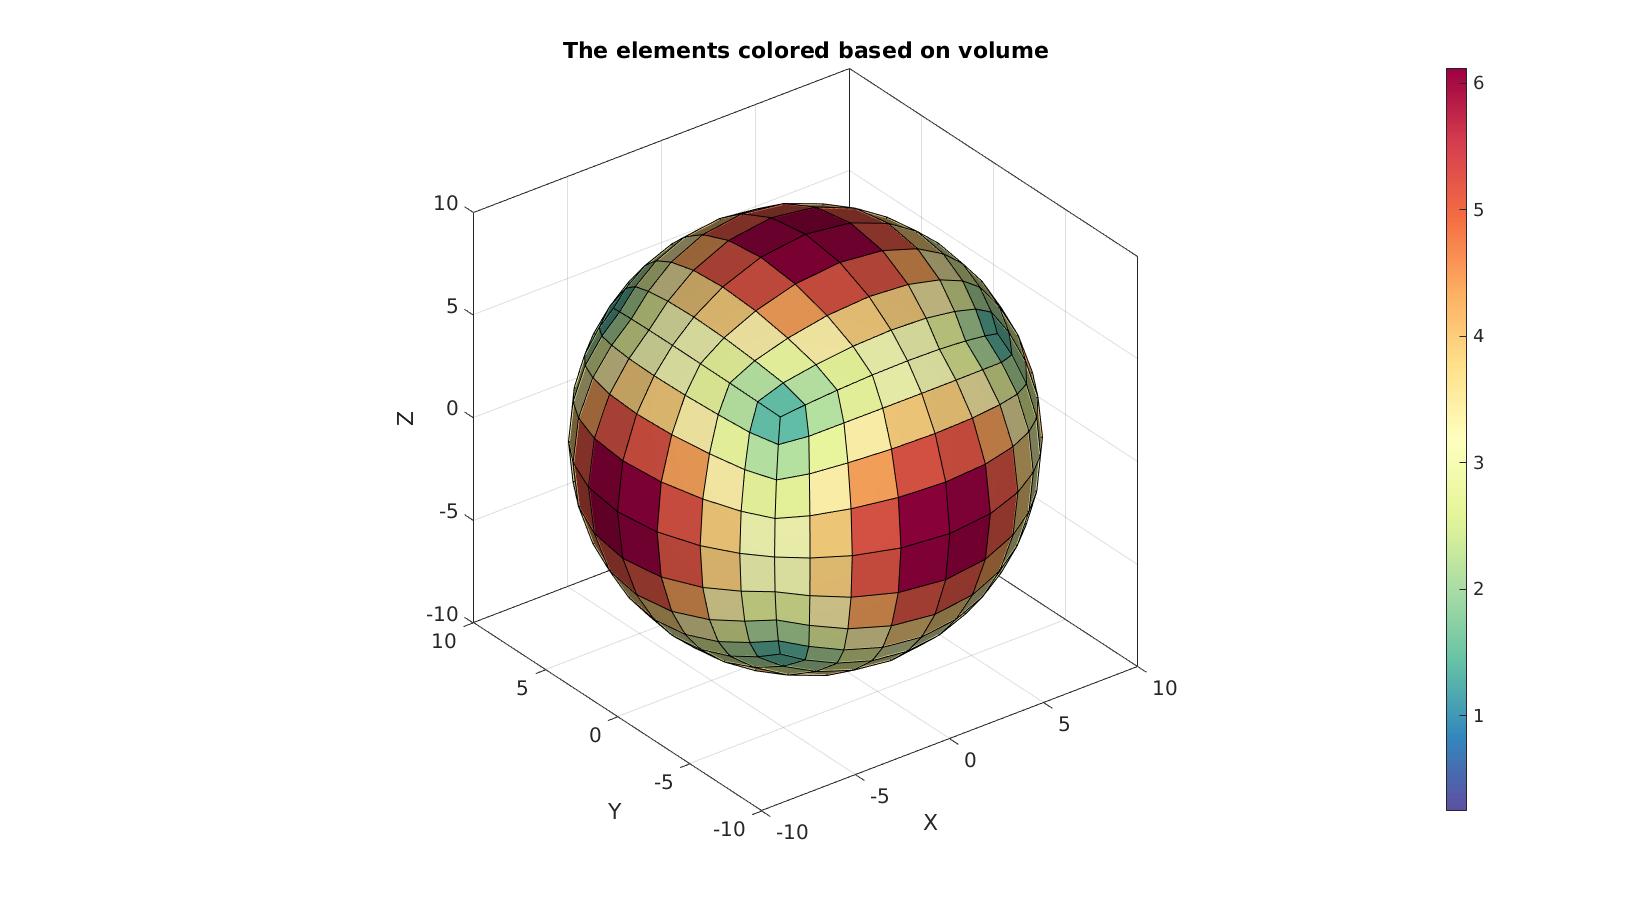
Visualize mesh and face normals
%Create patch data for plotting
[F,C]=element2patch(E,VE);

cFigure; hold on;
title('The elements colored based on volume')
gpatch(F,V,C,'k',1);
axisGeom; camlight headlight;
colormap spectral; colorbar;
drawnow;

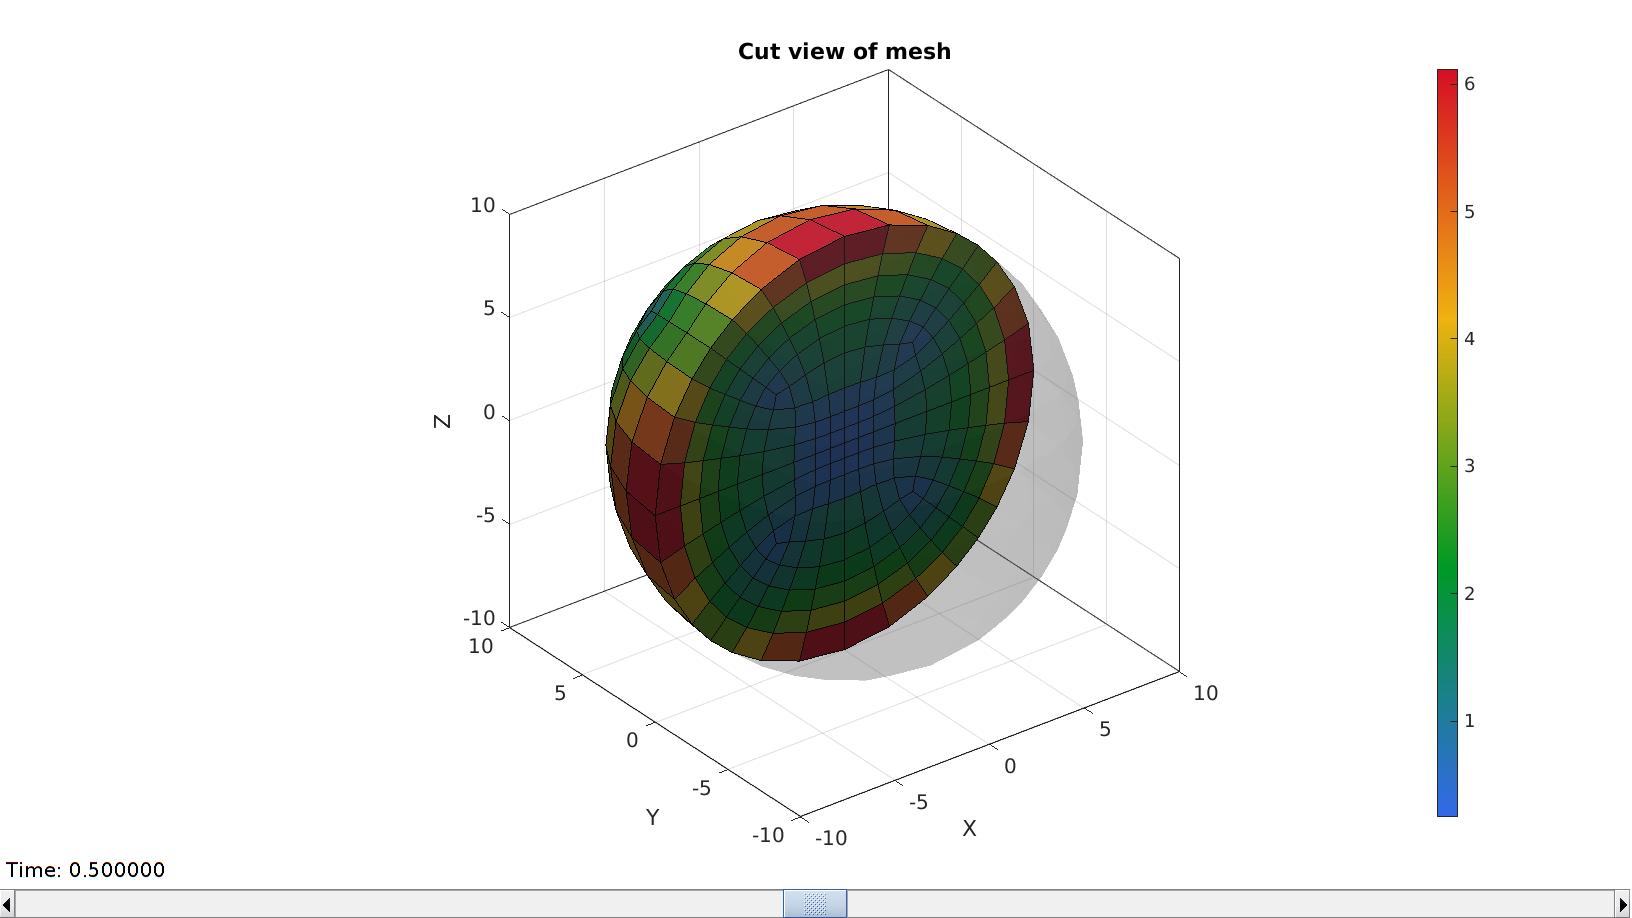
3D cut view
meshStruct.elementData=VE;
meshView(meshStruct,[]);


GIBBON www.gibboncode.org
Kevin Mattheus Moerman, [email protected]
GIBBON footer text
License: https://github.com/gibbonCode/GIBBON/blob/master/LICENSE
GIBBON: The Geometry and Image-based Bioengineering add-On. A toolbox for image segmentation, image-based modeling, meshing, and finite element analysis.
Copyright (C) 2006-2022 Kevin Mattheus Moerman and the GIBBON contributors
This program is free software: you can redistribute it and/or modify it under the terms of the GNU General Public License as published by the Free Software Foundation, either version 3 of the License, or (at your option) any later version.
This program is distributed in the hope that it will be useful, but WITHOUT ANY WARRANTY; without even the implied warranty of MERCHANTABILITY or FITNESS FOR A PARTICULAR PURPOSE. See the GNU General Public License for more details.
You should have received a copy of the GNU General Public License along with this program. If not, see http://www.gnu.org/licenses/.