multiRegionTriMesh2D
Below is a basic demonstration of the features of the multiRegionTriMesh2D function.
Contents
clear; close all; clc;
SIMULATING BOUNDARY CURVES
%Boundary 1
ns=150;
t=linspace(0,2*pi,ns);
t=t(1:end-1);
r=12+3.*sin(5*t);
[x,y] = pol2cart(t,r);
V1=[x(:) y(:)];

%Boundary 2
r=r/1.2;
[x,y] = pol2cart(t,r);
V2=[x(:) y(:)];

%Boundary 3
r=r/2;
[x,y] = pol2cart(t,r);
V3=[x(:) y(:)];
CREATING MULTI-REGION MESHES
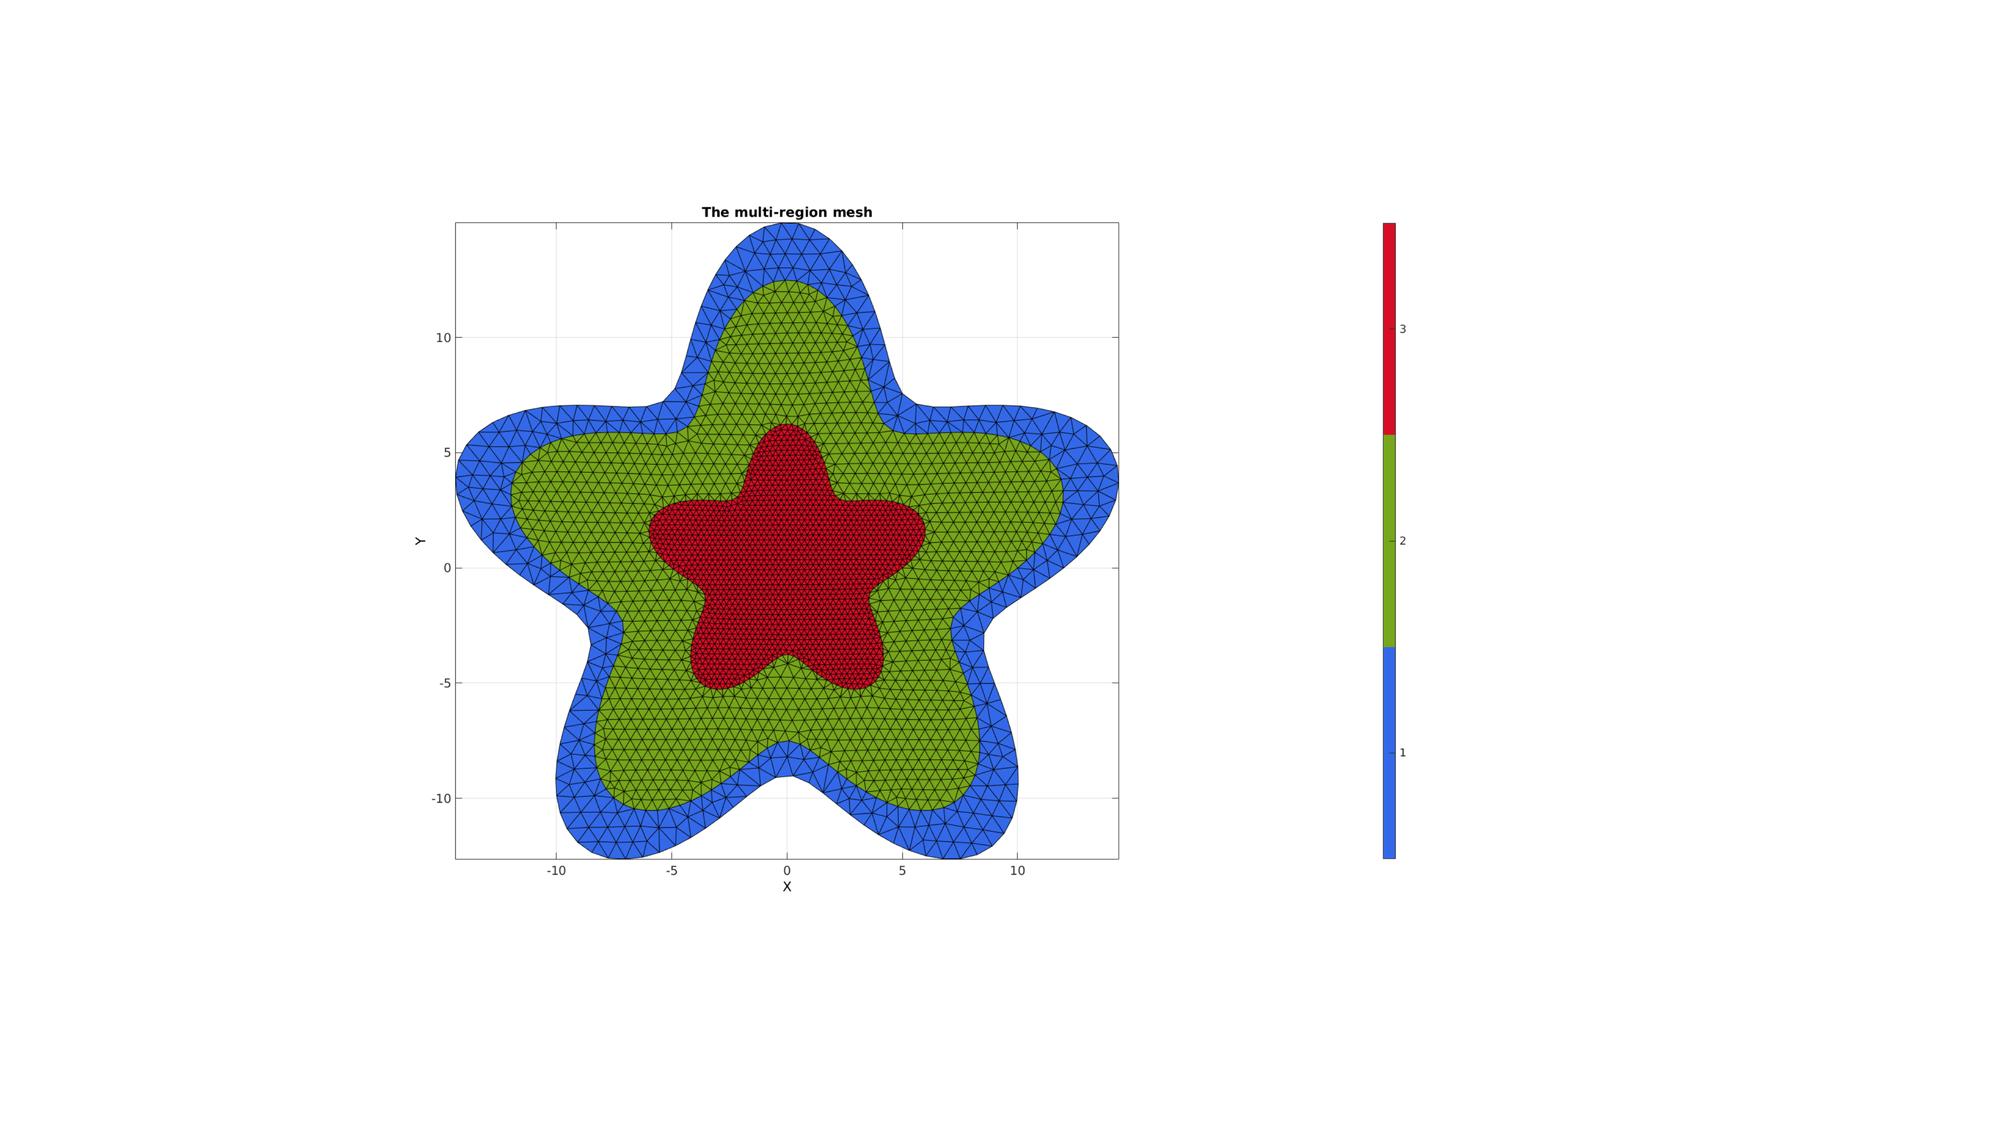
The first step is to define regions. Regions are defined as cell entries. for instance a cell called regionSpec. Each entry in regionSpec defines a region i.e. region 1 is found in regionSpec{1}. Each region entry is itself also a cell array containing all the boundary curves, e.g. for a two curve region 1 we would have something like regionSpec{1}={V1,V2} where V1 and V2 are the boundary curves. Multiple curves may be given here. The first curve should form the outer boundary of the entire region, the curves that follow should define holes inside this boundary and the material inside them is therefore not meshed. The boundary vertices for regions that share boundaries are merged and will share these boundary vertices. The function output contains the triangular faces in F, the vertices in V and the per triangle region indices in regionInd.
%Defining 4 regions
regionSpec{1}={V1,V2};
regionSpec{2}={V2,V3};
regionSpec{3}={V3};
BoundaryPointSpacings{1}={0.75,0.5}; %A region between V1 and V2 (V2 forms a hole inside V1)
BoundaryPointSpacings{2}={0.5,0.25}; %A region bound by V2 containing a set of holes defined by V3 up to V6
BoundaryPointSpacings{3}={0.25}; %A region bound by V2 containing a set of holes defined by V3 up to V6
MeshPointSpacings=[0.75 0.5 0.25];

plotOn=1; %This turns on/off plotting

%Desired point spacing
[F,V,regionInd]=multiRegionTriMeshUneven2D(regionSpec,BoundaryPointSpacings,MeshPointSpacings,plotOn);
% [F,V,regionInd]=multiRegionTriMesh2D(regionSpec,pointSpacing,plotOn);
% plotV(V1,'b-','LineWidth',2);
% plotV(V2,'b-','LineWidth',2);
% plotV(V3,'b-','LineWidth',2);

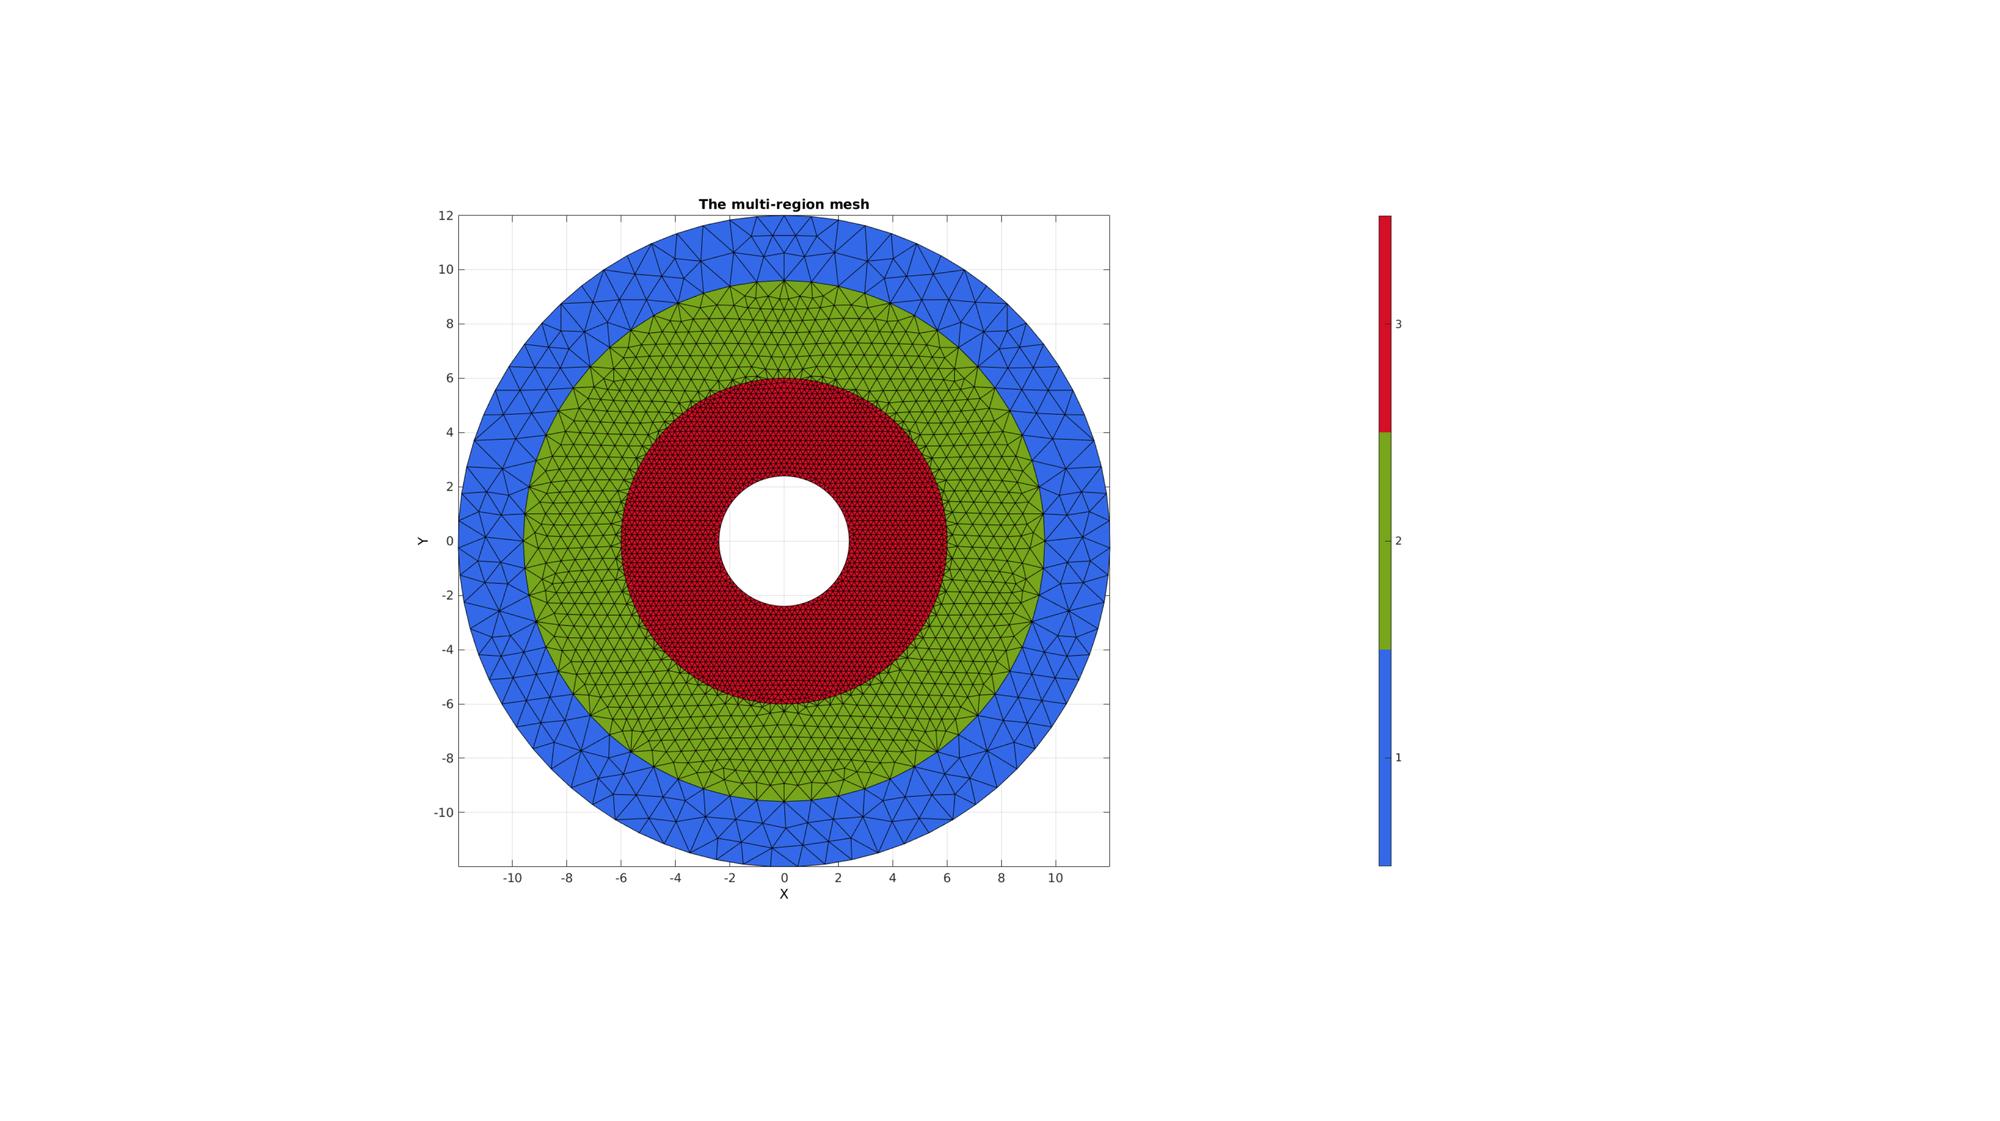
MESHES WITH HOLES
ns=150;
t=linspace(0,2*pi,ns);
t=t(1:end-1);
r=12;
x=r*sin(t);
y=r*cos(t);
V1=[x(:) y(:)];
x=r/1.25*sin(t);
y=r/1.25*cos(t);
V2=[x(:) y(:)];
x=r/2*sin(t);
y=r/2*cos(t);
V3=[x(:) y(:)];
x=r/5*sin(t);
y=r/5*cos(t);
V4=[x(:) y(:)];


%Defining 4 regions
regionSpec{1}={V1,V2};
regionSpec{2}={V2,V3};
regionSpec{3}={V3,V4};
BoundaryPointSpacings{1}={1,1}; %A region between V1 and V2 (V2 forms a hole inside V1)
BoundaryPointSpacings{2}={1,0.2}; %A region bound by V2 containing a set of holes defined by V3 up to V6
BoundaryPointSpacings{3}={0.2,0.2}; %A region bound by V2 containing a set of holes defined by V3 up to V6
MeshPointSpacings=[1 0.5 0.2];

plotOn=1; %This turns on/off plotting

%Desired point spacing
[F,V,regionInd]=multiRegionTriMeshUneven2D(regionSpec,BoundaryPointSpacings,MeshPointSpacings,plotOn);
% [F,V,regionInd]=multiRegionTriMesh2D(regionSpec,pointSpacing,plotOn);
% plotV(V1,'b-','LineWidth',2);
% plotV(V2,'b-','LineWidth',2);
% plotV(V3,'b-','LineWidth',2);


GIBBON www.gibboncode.org
Kevin Mattheus Moerman, [email protected]
GIBBON footer text
License: https://github.com/gibbonCode/GIBBON/blob/master/LICENSE
GIBBON: The Geometry and Image-based Bioengineering add-On. A toolbox for image segmentation, image-based modeling, meshing, and finite element analysis.
Copyright (C) 2019 Kevin Mattheus Moerman
This program is free software: you can redistribute it and/or modify it under the terms of the GNU General Public License as published by the Free Software Foundation, either version 3 of the License, or (at your option) any later version.
This program is distributed in the hope that it will be useful, but WITHOUT ANY WARRANTY; without even the implied warranty of MERCHANTABILITY or FITNESS FOR A PARTICULAR PURPOSE. See the GNU General Public License for more details.
You should have received a copy of the GNU General Public License along with this program. If not, see http://www.gnu.org/licenses/.