quiverLine
Below is a demonstration of the features of the quiverLine function
Contents
clear; close all; clc;
Syntax
|[hp]=quiverLine(P,V,vecSize,colorSpec,lineWidth,quiverStyleOpt,alphaLevel);
Description
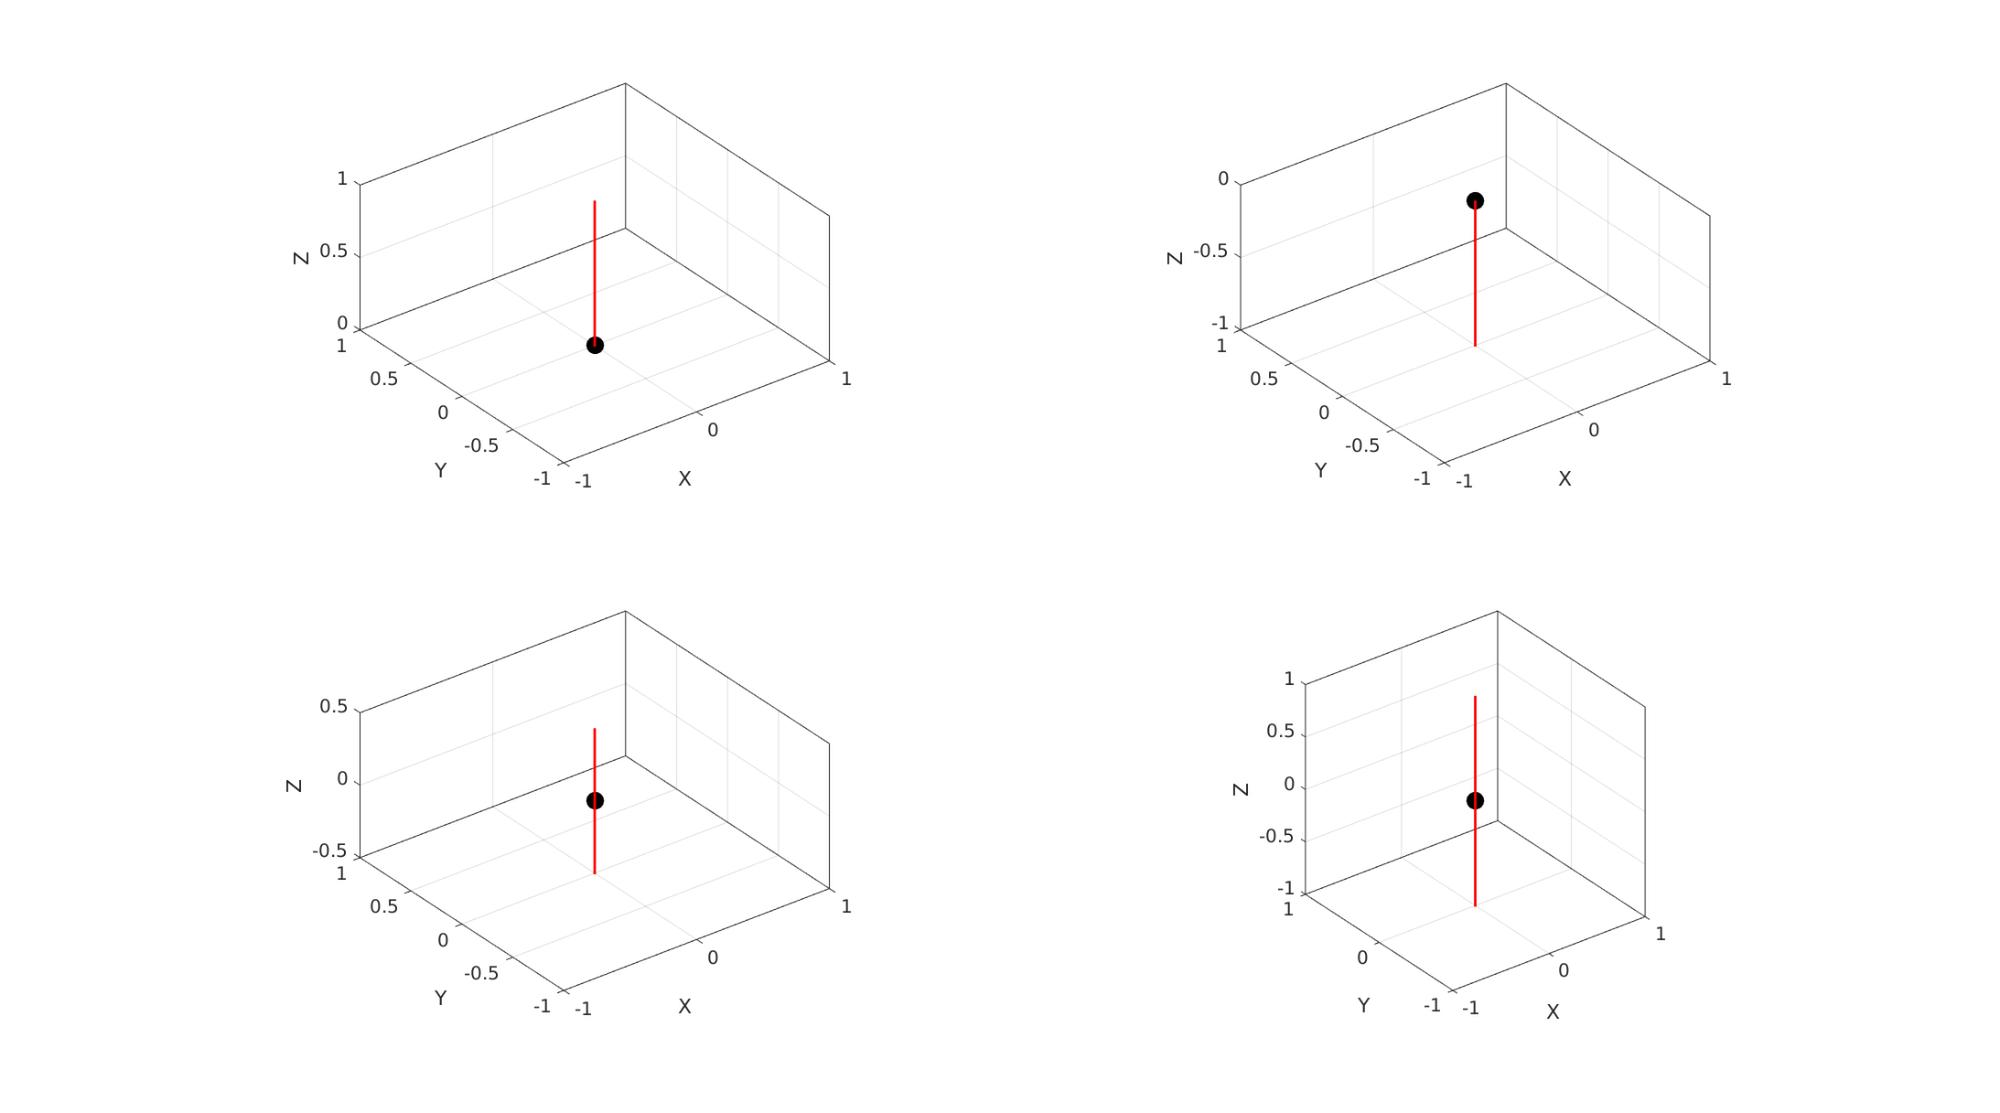
This function is a short-hand version of the quiver3Dpatch function which enables colormapped and 3D rendering of directional or vector data. The inputs are: P: The vector origins V: The vectors vecSize: The vector sizes colorSpec: The color data which is a string, rgb values or colormapped arrays lineWidth: Line width of the vector quiverStyleOpt: The quiver style, which is 1=normal arrow, 2=Arrive at origin, 3=Pass through origin, 4=Two-sided. alphaLevel: the transparancy level
Examples
clear; close all; clc;
Plot settings
cMap=viridis(250);
fontSize=15;
P=[0 0 0];
V=[0 0 1];

quiverStyleOpt_set=[1 2 3 4];
vecLength=1;
lineWidth=2;
vecAlpha=1;

cFigure;

for q=1:1:4

    subplot(2,2,q); hold on;
    plotV(P,'k.','MarkerSize',50);
    quiverLine(P,V,vecLength,'r',lineWidth,quiverStyleOpt_set(q),vecAlpha);
    axisGeom;

end
drawnow;

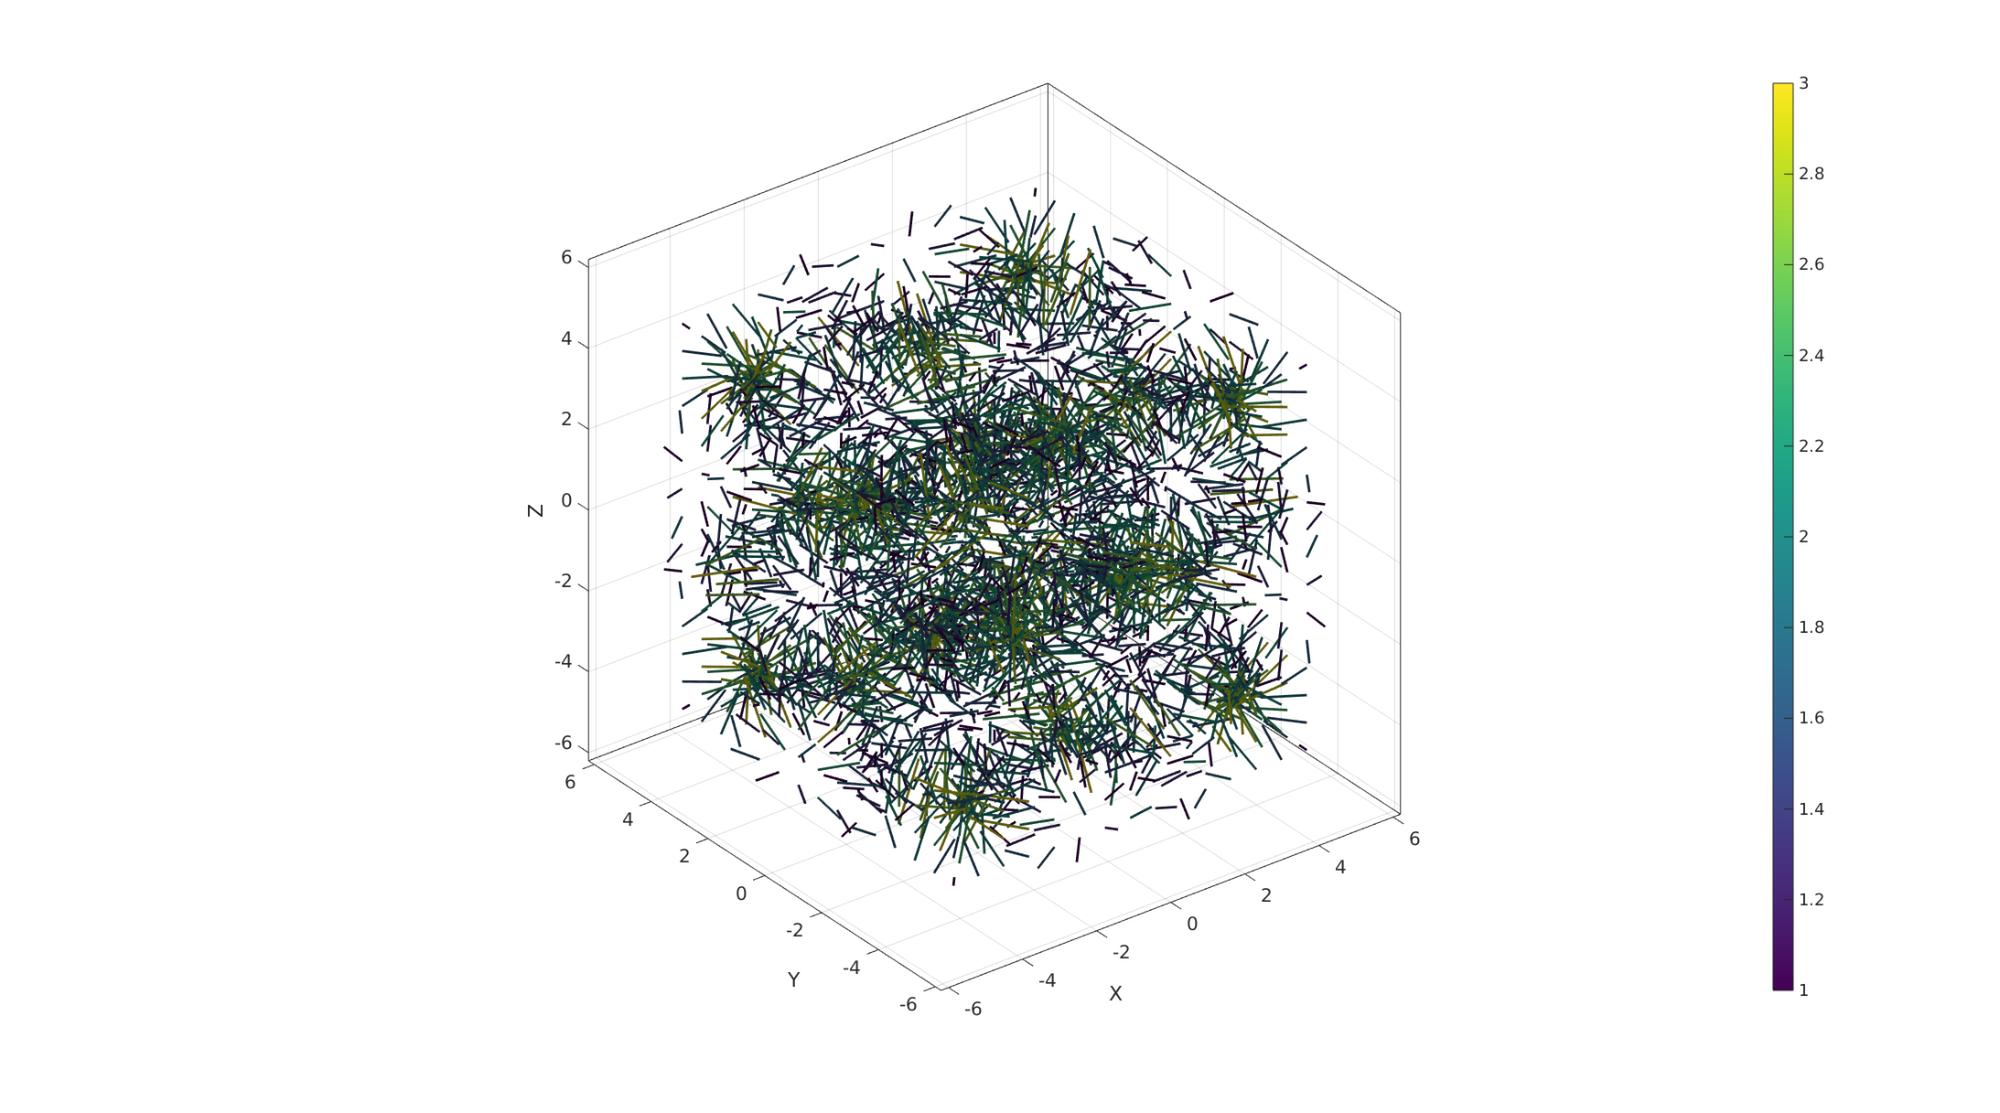
Example for multidimensional image data: colormap driven vectors
Simulating 3D volume and vector data
n=15;
[X,Y,Z]=meshgrid(linspace(-4.77,4.77,n));
phi=(1+sqrt(5))/2;
M=2 - (cos(X + phi*Y) + cos(X - phi*Y) + cos(Y + phi*Z) + cos(Y - phi*Z) + cos(Z - phi*X) + cos(Z + phi*X));
[u,v,w] = gradient(M); %Vector components
C=hypot(hypot(u(:),v(:)),w(:)); %Vector lenghts
P=[X(:) Y(:) Z(:)];
V=[u(:) v(:) w(:)];
cFigure;

quiverLine(P,V,C,C);

colormap(cMap); colorbar;
axisGeom(gca,fontSize);
camlight headlight; lighting flat
clim([1 3])
drawnow;

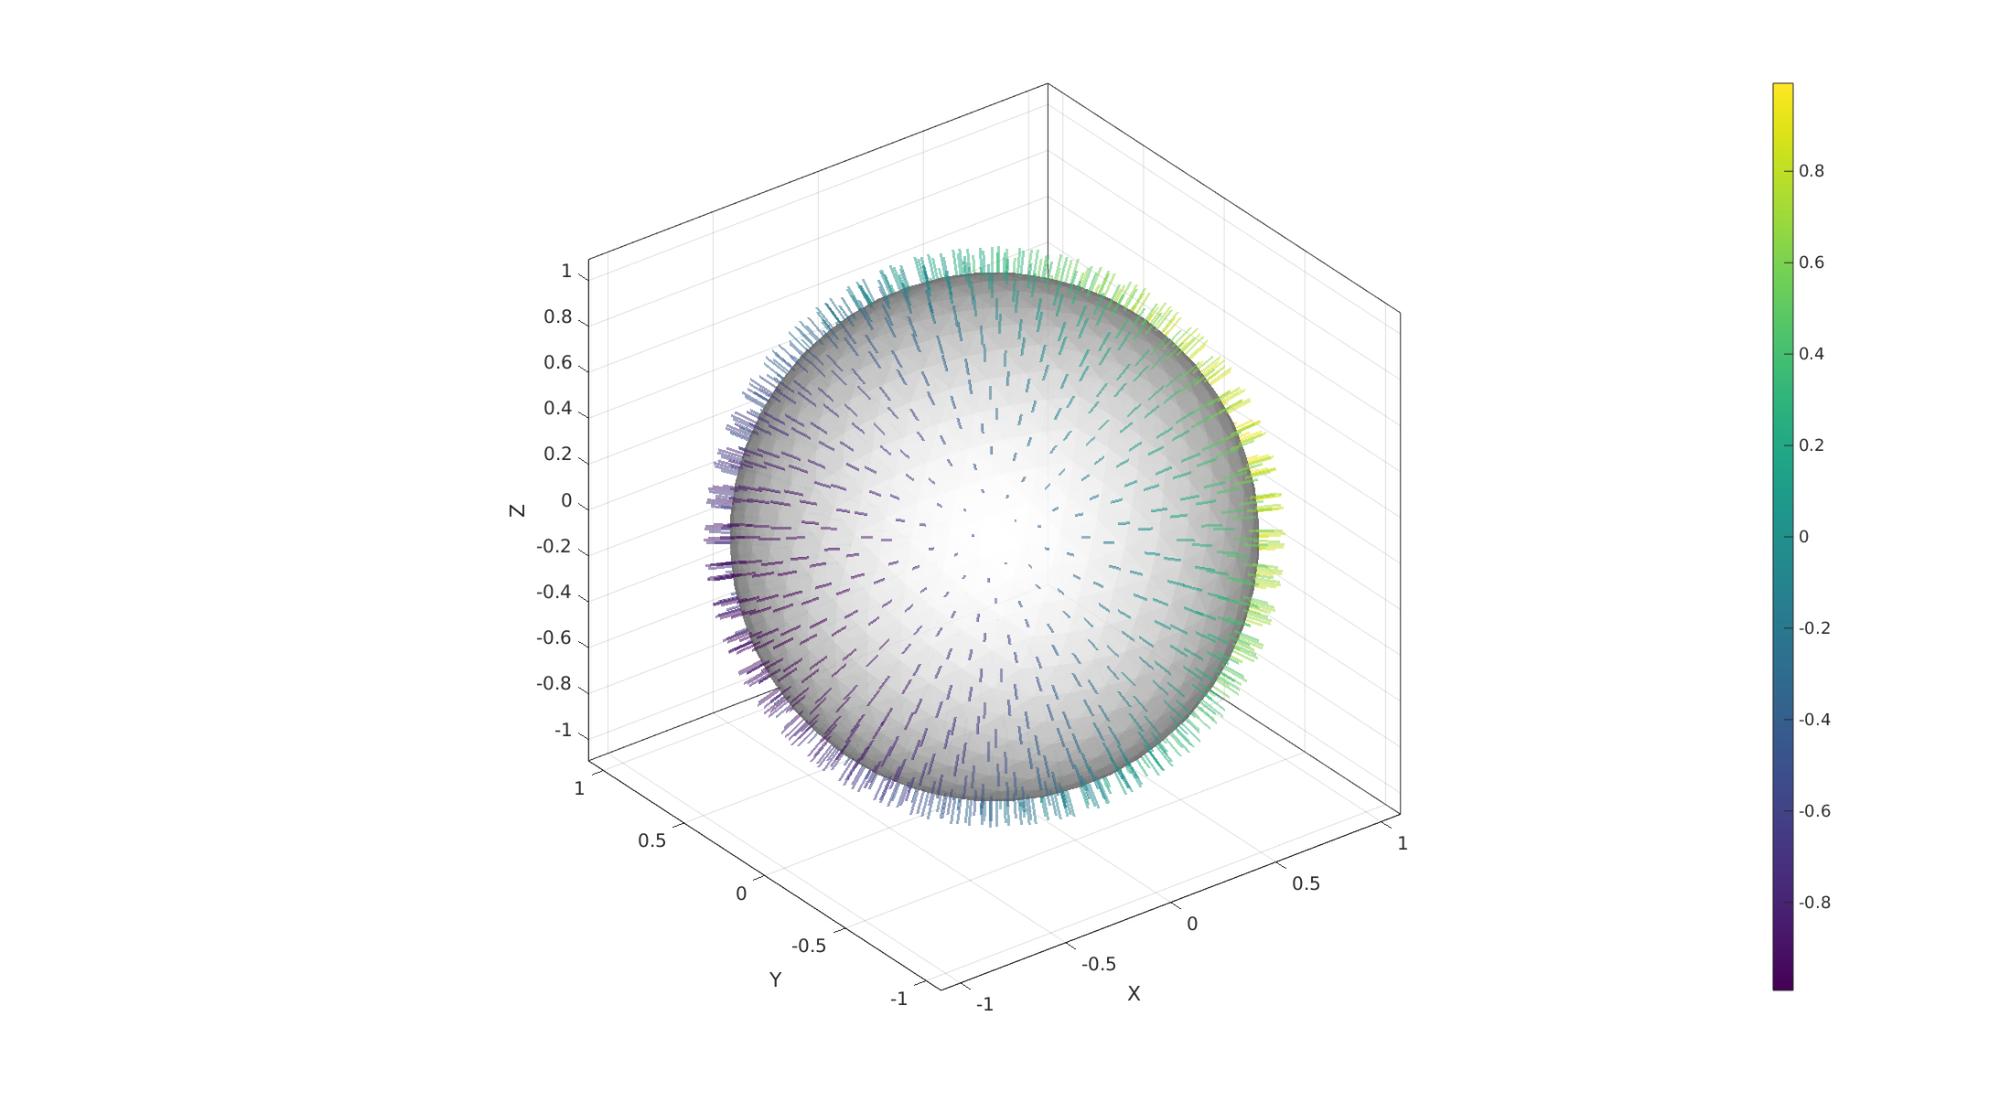
Example for face normal plotting with variable color
See also patchNormPlot
Creating a surface model
[F,V]=geoSphere(3,1);
[N,Vn]=patchNormal(F,V); %Get face normals
Cn=Vn(:,1); %Color data
vecLength=0.1;
lineWidth=2;
quiverStyleOpt=1;
vecAlpha=0.5;

cFigure;

gpatch(F,V,'w','none',0.8);
quiverLine(Vn,N,vecLength,Cn,lineWidth,quiverStyleOpt,vecAlpha);

colormap(cMap); colorbar;
axisGeom(gca,fontSize);
camlight headlight;
drawnow;


GIBBON www.gibboncode.org
Kevin Mattheus Moerman, [email protected]
GIBBON footer text
License: https://github.com/gibbonCode/GIBBON/blob/master/LICENSE
GIBBON: The Geometry and Image-based Bioengineering add-On. A toolbox for image segmentation, image-based modeling, meshing, and finite element analysis.
Copyright (C) 2006-2023 Kevin Mattheus Moerman and the GIBBON contributors
This program is free software: you can redistribute it and/or modify it under the terms of the GNU General Public License as published by the Free Software Foundation, either version 3 of the License, or (at your option) any later version.
This program is distributed in the hope that it will be useful, but WITHOUT ANY WARRANTY; without even the implied warranty of MERCHANTABILITY or FITNESS FOR A PARTICULAR PURPOSE. See the GNU General Public License for more details.
You should have received a copy of the GNU General Public License along with this program. If not, see http://www.gnu.org/licenses/.