sampleCurveEvenly
Below is a basic demonstration of the features of the sampleCurveEvenly function.
Contents
clear; close all; clc;

% PLOT SETTINGS
fig_color='w'; fig_colordef='white';
markerSize=15;
lineWidth=2;
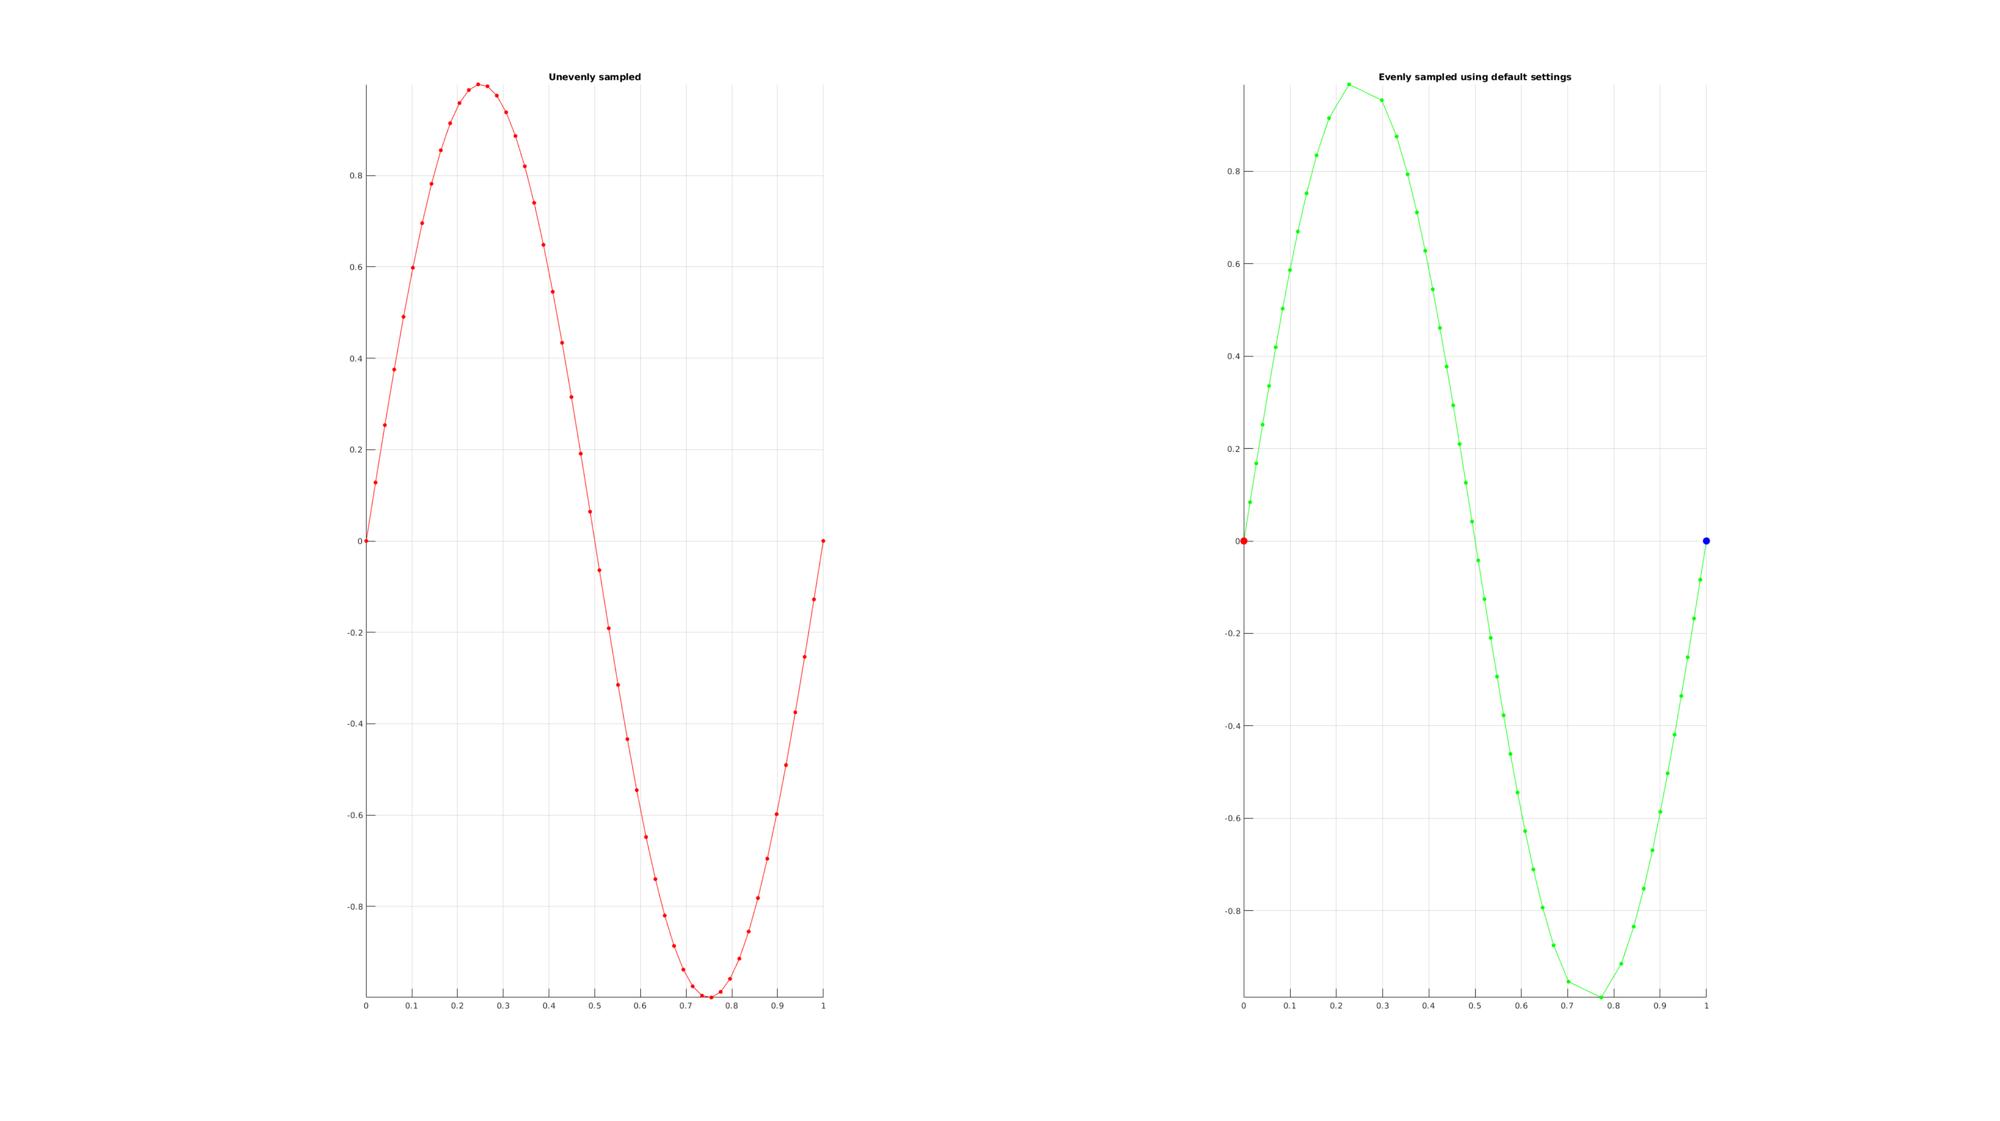
EXAMPLE USING DEFAULT SETTINGS FOR RESAMPLING A CURVE EVENLY
%Simulating the case of an unevenly sampled loop curve
ns=50;
x=linspace(0,1,ns); %evenly spaced x data
y=sin(x*2*pi); %resulting y data
V=[x(:) y(:)]; %nonlinearity causing uneven point spacing

cPar=[]; %If the control structure is empty these are the settings used:

% cPar.nd=size(V,1); %resample with the same about of points
% cPar.typeOpt='num'; %curve steps are based on the desired number of points
% cPar.interpMethod='pchip'; %use pchip interpolation
% cPar.closeLoopOpt=0; %the curve is not a closed loop

[Vg]=sampleCurveEvenly(V,cPar);

cFigure;
subplot(1,2,1); hold on;
title('Unevenly sampled');
plotV(V,'r.-','MarkerSize',markerSize);
view(2); grid on; axis equal; axis tight;
subplot(1,2,2); hold on;
title('Evenly sampled using default settings');
plotV(Vg,'g.-','MarkerSize',markerSize);
plotV(Vg(1,:),'r.','MarkerSize',2*markerSize,'lineWidth',lineWidth);
plotV(Vg(end,:),'b.','MarkerSize',2*markerSize,'lineWidth',lineWidth);
view(2); grid on; axis equal; axis tight;
drawnow;
Warning: This function will be replaced by evenlySampleCurve
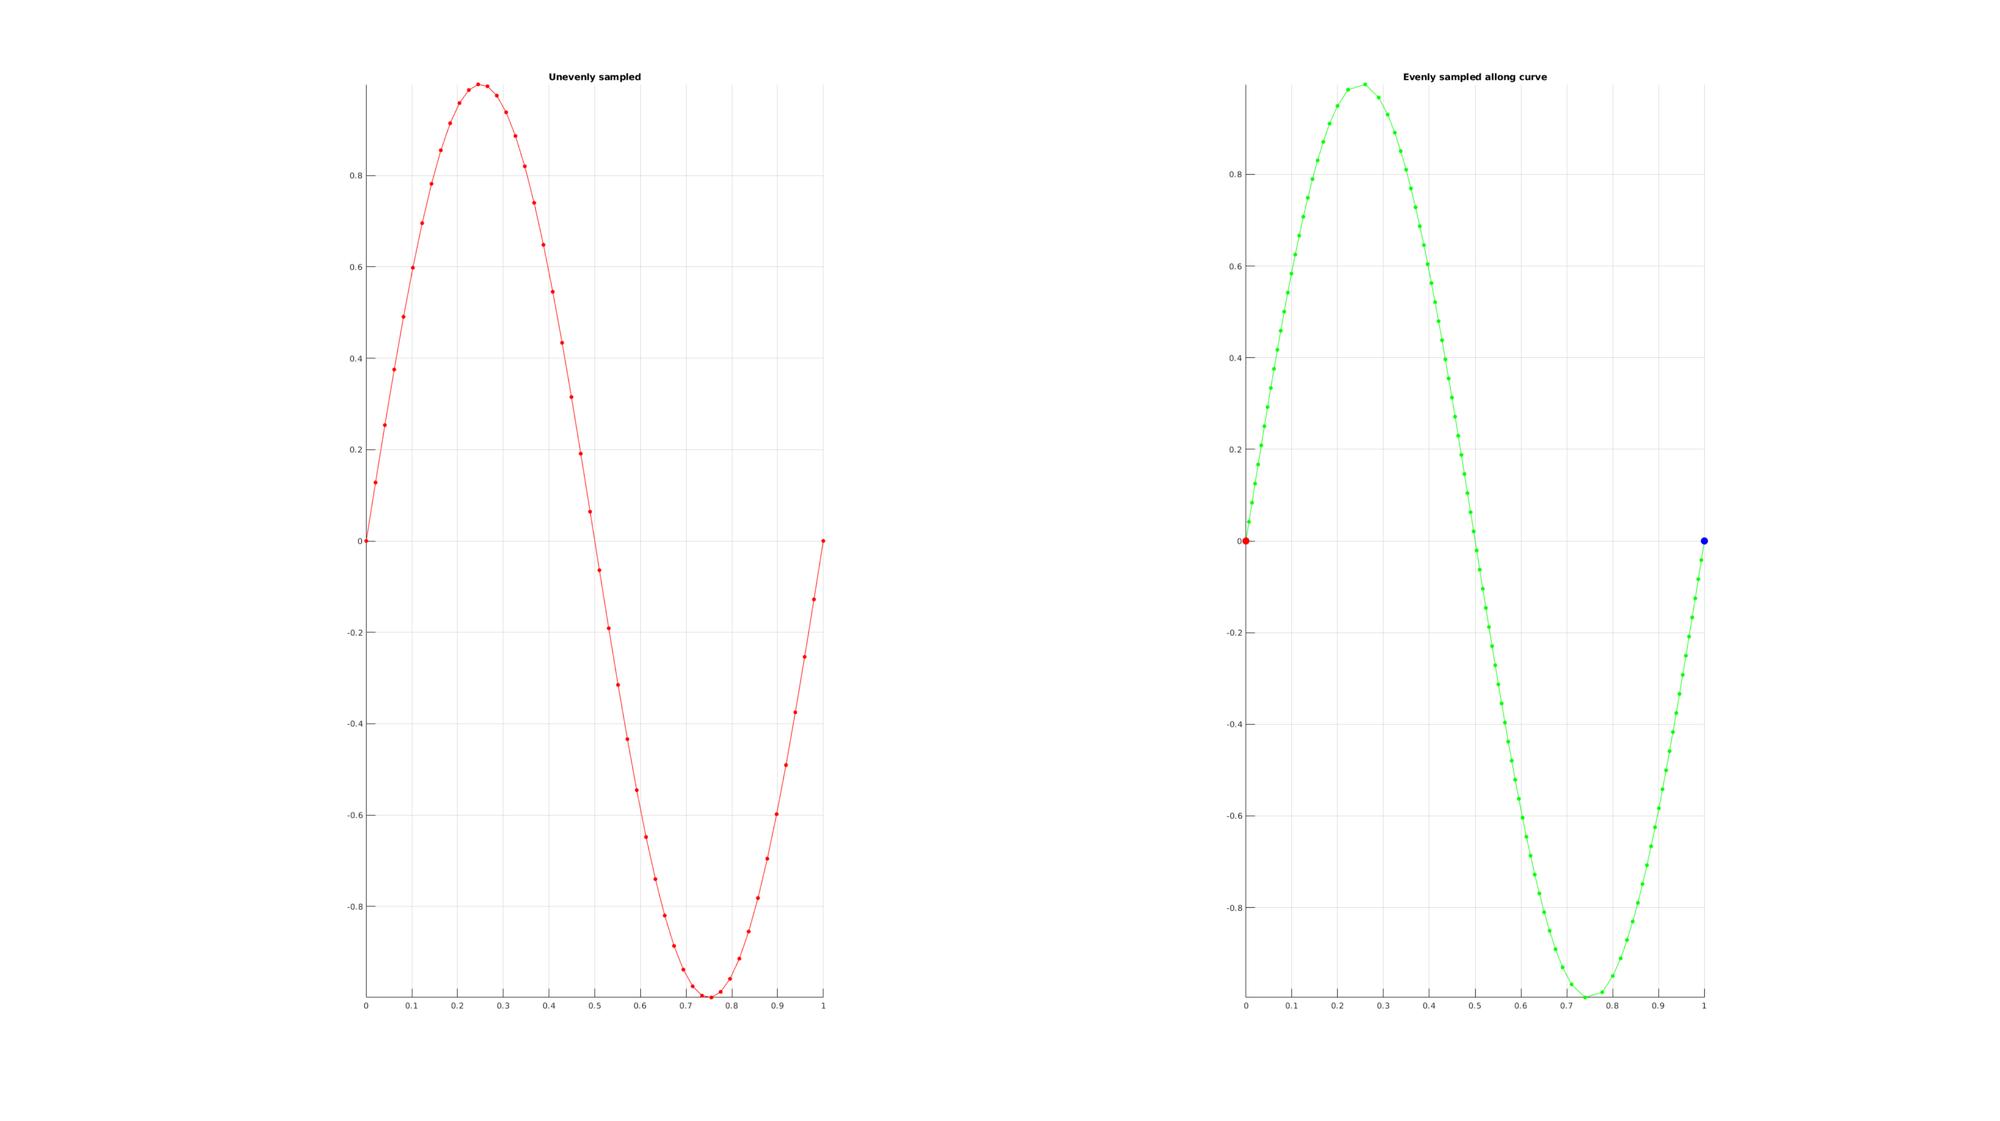
EXAMPLE USING CUSTOM SETTINGS FOR RESAMPLING A CURVE EVENLY
%Simulating the case of an unevenly sampled loop curve

cPar.nd=size(V,1)*2; %upsample twice
cPar.typeOpt='num'; %curve steps are based on the desired number of points
cPar.interpMethod='linear'; %use linear interpolation
cPar.closeLoopOpt=0; %the curve is not a closed loop

[Vg]=sampleCurveEvenly(V,cPar);

cFigure;
subplot(1,2,1); hold on;
title('Unevenly sampled');
plotV(V,'r.-','MarkerSize',markerSize);
view(2); grid on; axis equal; axis tight;
subplot(1,2,2); hold on;
title('Evenly sampled allong curve');
plotV(Vg,'g.-','MarkerSize',markerSize);
plotV(Vg(1,:),'r.','MarkerSize',2*markerSize,'lineWidth',lineWidth);
plotV(Vg(end,:),'b.','MarkerSize',2*markerSize,'lineWidth',lineWidth);
view(2); grid on; axis equal; axis tight;
drawnow;
Warning: This function will be replaced by evenlySampleCurve
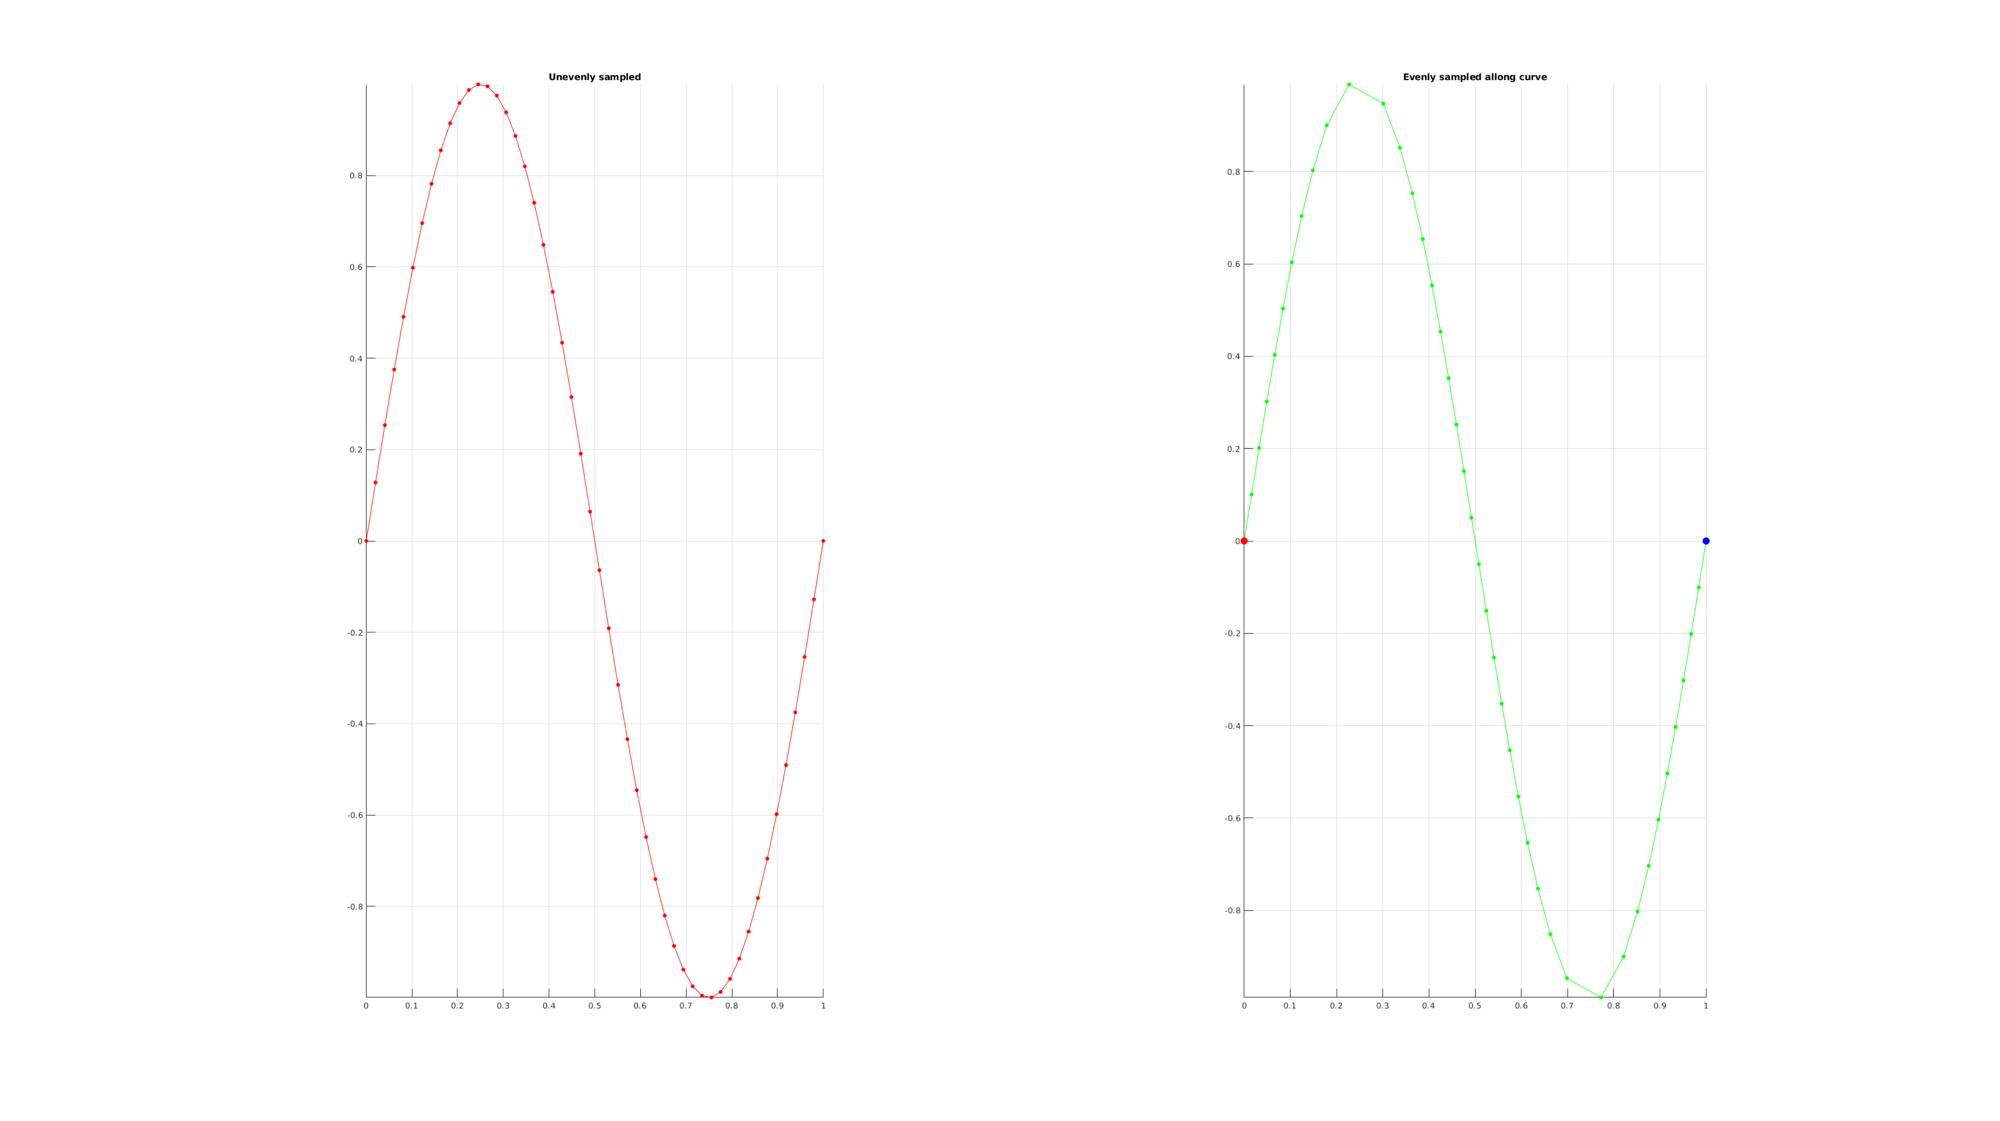
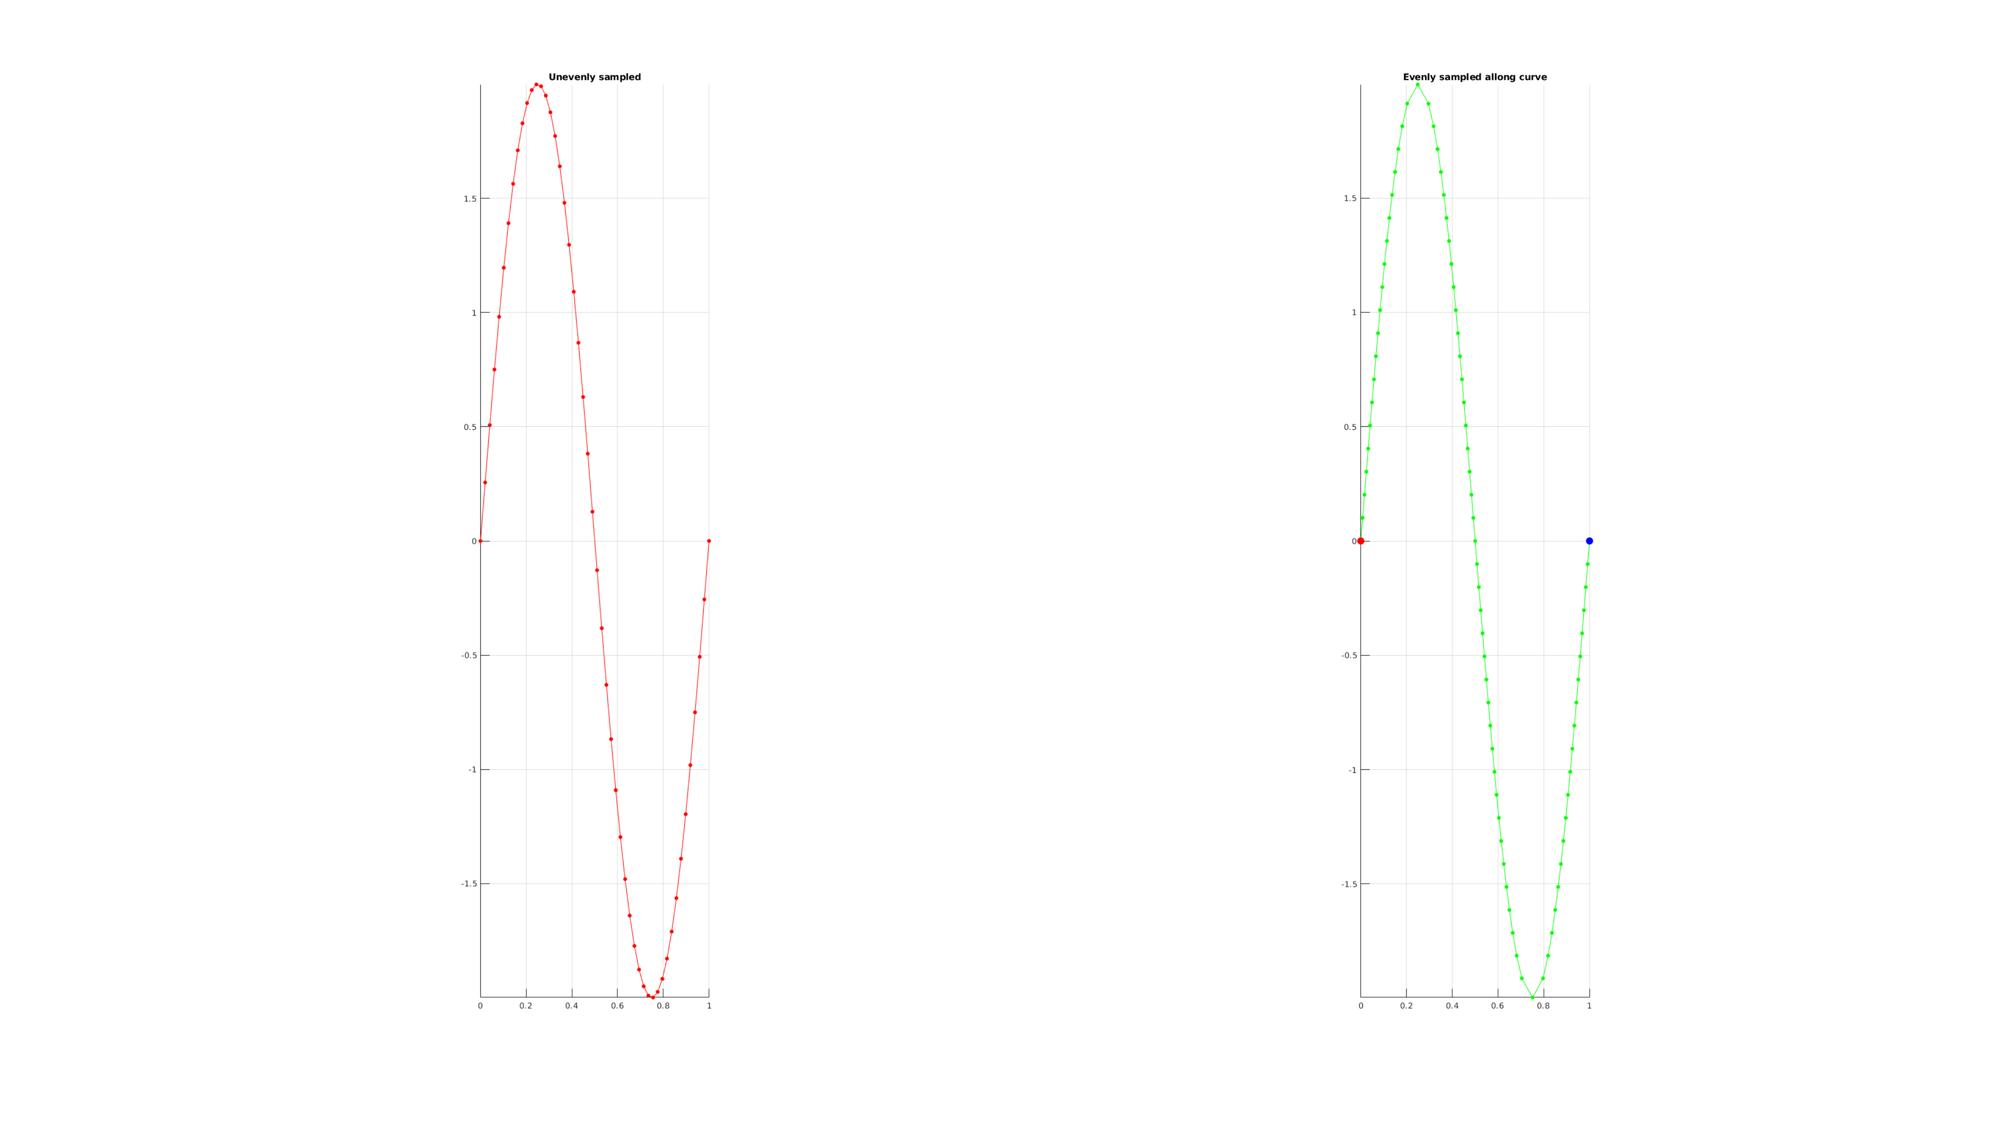
EXAMPLE USING CUSTOM SETTINGS FOR RESAMPLING A CURVE EVENLY
%Simulating the case of an unevenly sampled loop curve

cPar.nd=0.1; %resmaple based on curve length step size
cPar.typeOpt='dist'; %curve steps are based on the desired number of points
cPar.interpMethod='linear'; %use linear interpolation
cPar.closeLoopOpt=0; %the curve is not a closed loop

[Vg]=sampleCurveEvenly(V,cPar);

cFigure;
subplot(1,2,1); hold on;
title('Unevenly sampled');
plotV(V,'r.-','MarkerSize',markerSize);
view(2); grid on; axis equal; axis tight;
subplot(1,2,2); hold on;
title('Evenly sampled allong curve');
plotV(Vg,'g.-','MarkerSize',markerSize);
plotV(Vg(1,:),'r.','MarkerSize',2*markerSize,'lineWidth',lineWidth);
plotV(Vg(end,:),'b.','MarkerSize',2*markerSize,'lineWidth',lineWidth);
view(2); grid on; axis equal; axis tight;
drawnow;

V(:,2)=V(:,2)*2; %Increasing amplitude increases point spacing and  hence increases number of point used for curve step size resampling

cPar.nd=0.1; %resample based on curve length step size
cPar.typeOpt='dist'; %curve steps are based on the desired number of points
cPar.interpMethod='linear'; %use linear interpolation
cPar.closeLoopOpt=0; %the curve is not a closed loop

[Vg]=sampleCurveEvenly(V,cPar);

cFigure;
subplot(1,2,1); hold on;
title('Unevenly sampled');
plotV(V,'r.-','MarkerSize',markerSize);
view(2); grid on; axis equal; axis tight;
subplot(1,2,2); hold on;
title('Evenly sampled allong curve');
plotV(Vg,'g.-','MarkerSize',markerSize);
plotV(Vg(1,:),'r.','MarkerSize',2*markerSize,'lineWidth',lineWidth);
plotV(Vg(end,:),'b.','MarkerSize',2*markerSize,'lineWidth',lineWidth);
view(2); grid on; axis equal; axis tight;
drawnow;
Warning: This function will be replaced by evenlySampleCurve
Warning: This function will be replaced by evenlySampleCurve
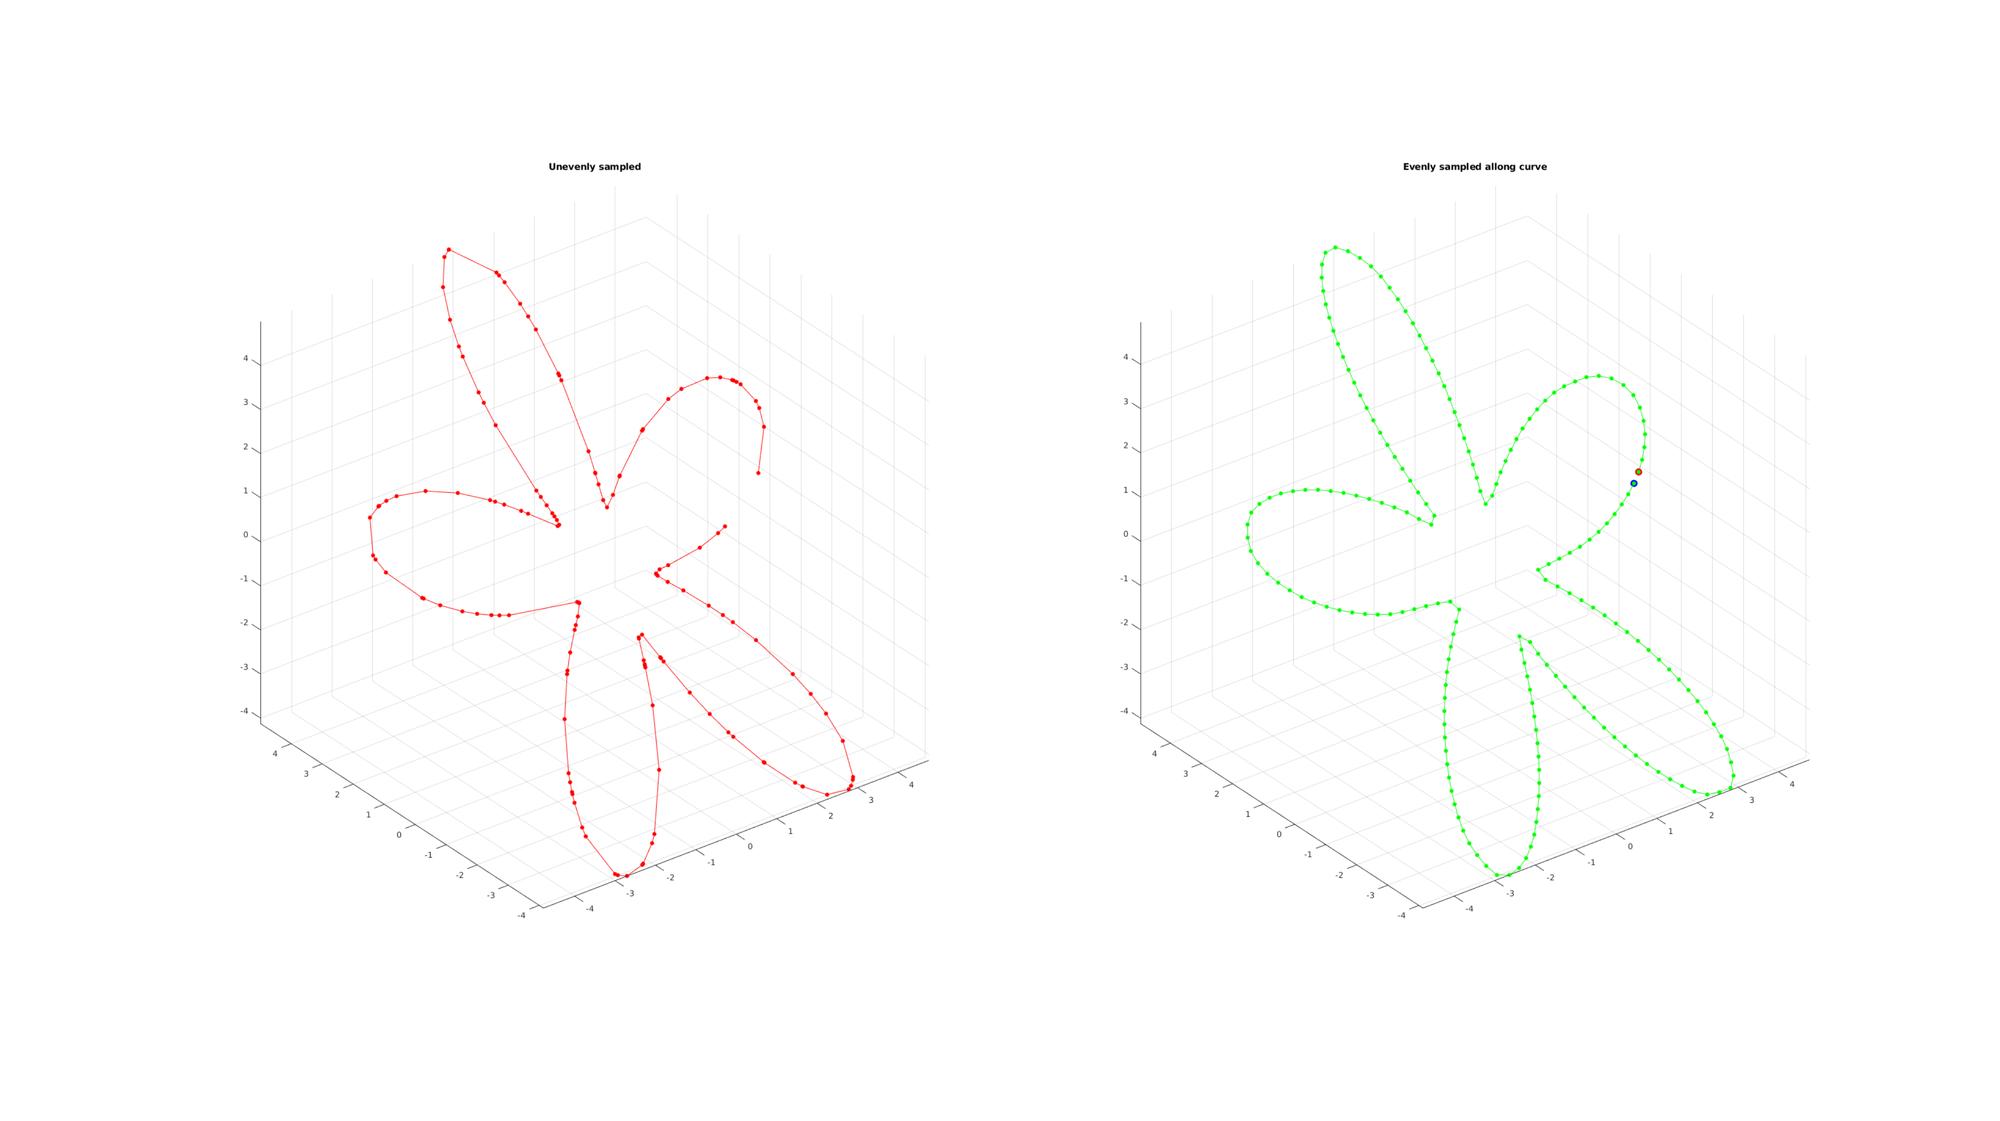
EXAMPLE USING CUSTOM SETTINGS FOR RESAMPLING A CLOSED POLYGON EVENLY
%Simulating the case of an unevenly sampled loop curve
ns=150;
t=sort(linspace(0,2*pi,ns)+pi/10*rand(1,ns));
t=unique(t); %removing double points
t=t(t<2*pi);%Removing 2*pi points since they are the same as the 0 point
r=3+2.*sin(5*t);
[x,y] = pol2cart(t,r);
z=y;
V=[x(:) y(:) z(:)];

cPar.nd=200; %Desired number of pointsupsample twice
cPar.typeOpt='num'; %curve steps are based on the desired number of points
cPar.interpMethod='pchip'; %use pchip interpolation
cPar.closeLoopOpt=1; %the curve is close so the end is considered equal to the start

[Vg]=sampleCurveEvenly(V,cPar);

cFigure;
subplot(1,2,1); hold on;
title('Unevenly sampled');
plot3(V(:,1),V(:,2),V(:,3),'r.-','MarkerSize',markerSize);
drawnow; view(3); grid on; axis equal; axis tight;
subplot(1,2,2); hold on;
title('Evenly sampled allong curve');
plot3(Vg(:,1),Vg(:,2),Vg(:,3),'g.-','MarkerSize',markerSize);
plot3(Vg(1,1),Vg(1,2),Vg(1,3),'r.','MarkerSize',2*markerSize,'lineWidth',lineWidth);
plot3(Vg(end,1),Vg(end,2),Vg(end,3),'b.','MarkerSize',2*markerSize,'lineWidth',lineWidth);
drawnow; view(3); grid on; axis equal; axis tight;
Warning: This function will be replaced by evenlySampleCurve
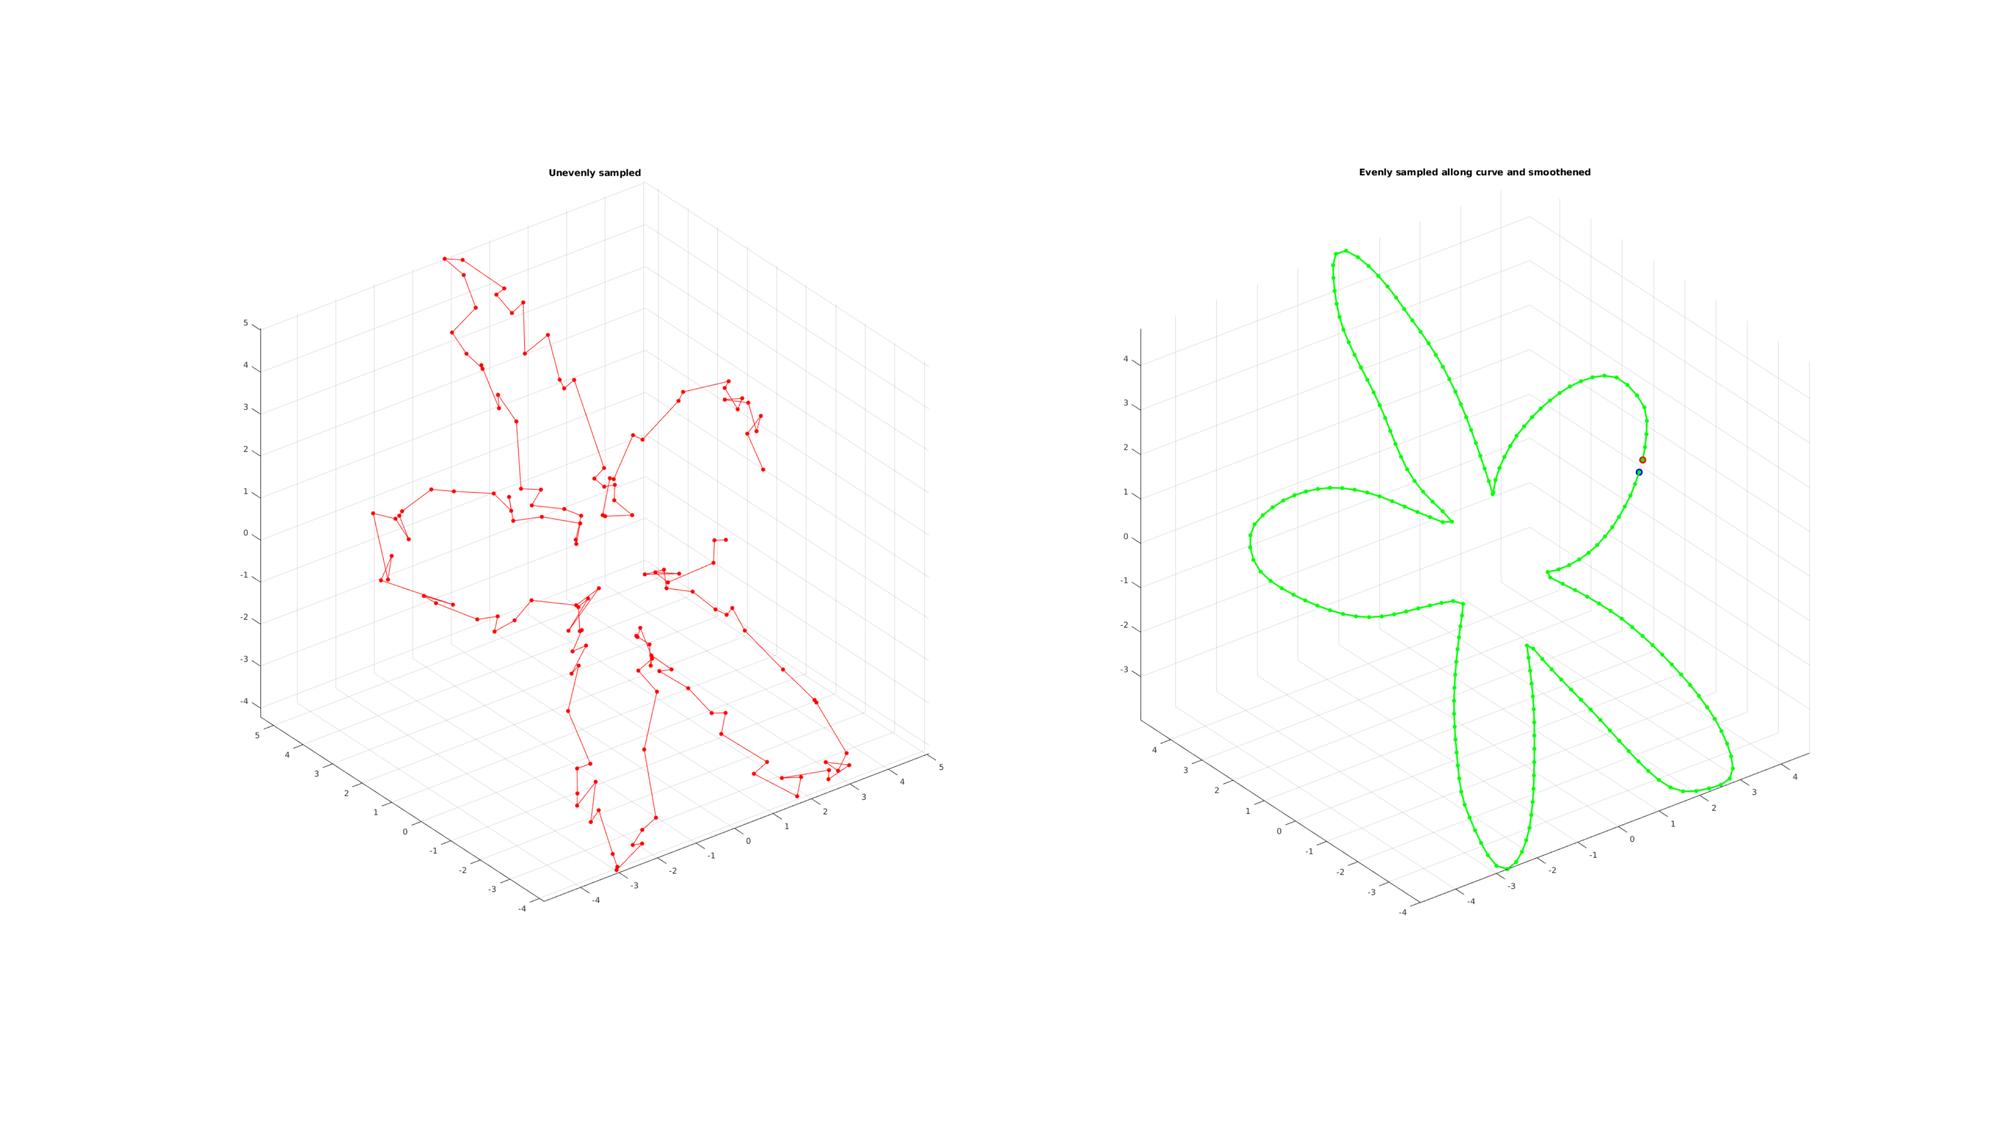
EXAMPLE USING CURVE SMOOTHENING
%Adding noise
V=V+0.2.*randn(size(V));

cPar.nd=200;
cPar.typeOpt='num';
cPar.interpMethod=0.5;
cPar.closeLoopOpt=1;

[Vg]=sampleCurveEvenly(V,cPar);

cFigure;
subplot(1,2,1); hold on;
title('Unevenly sampled');
plot3(V(:,1),V(:,2),V(:,3),'r.-','MarkerSize',markerSize);
drawnow; view(3); grid on; axis equal; axis tight;
subplot(1,2,2); hold on;
title('Evenly sampled allong curve and smoothened');
plot3(Vg(:,1),Vg(:,2),Vg(:,3),'g.-','MarkerSize',markerSize,'lineWidth',lineWidth);
plot3(Vg(1,1),Vg(1,2),Vg(1,3),'r.','MarkerSize',2*markerSize,'lineWidth',lineWidth);
plot3(Vg(end,1),Vg(end,2),Vg(end,3),'b.','MarkerSize',2*markerSize,'lineWidth',lineWidth);
drawnow; view(3); grid on; axis equal; axis tight;
Warning: This function will be replaced by evenlySampleCurve

GIBBON www.gibboncode.org
Kevin Mattheus Moerman, [email protected]
GIBBON footer text
License: https://github.com/gibbonCode/GIBBON/blob/master/LICENSE
GIBBON: The Geometry and Image-based Bioengineering add-On. A toolbox for image segmentation, image-based modeling, meshing, and finite element analysis.
Copyright (C) 2019 Kevin Mattheus Moerman
This program is free software: you can redistribute it and/or modify it under the terms of the GNU General Public License as published by the Free Software Foundation, either version 3 of the License, or (at your option) any later version.
This program is distributed in the hope that it will be useful, but WITHOUT ANY WARRANTY; without even the implied warranty of MERCHANTABILITY or FITNESS FOR A PARTICULAR PURPOSE. See the GNU General Public License for more details.
You should have received a copy of the GNU General Public License along with this program. If not, see http://www.gnu.org/licenses/.