tet2hex
Below is a demonstration of the features of the tet2hex function
Contents
Syntax
[Es,Vs]=tet2hex(E,V);
Description
Examples
clear; close all; clc;
Plot settings
fontSize=25;
faceAlpha=0.3;
edgeColor=0.*ones(1,3);
edgeWidth=3;
markerSize=75;
cMap=gjet(4);
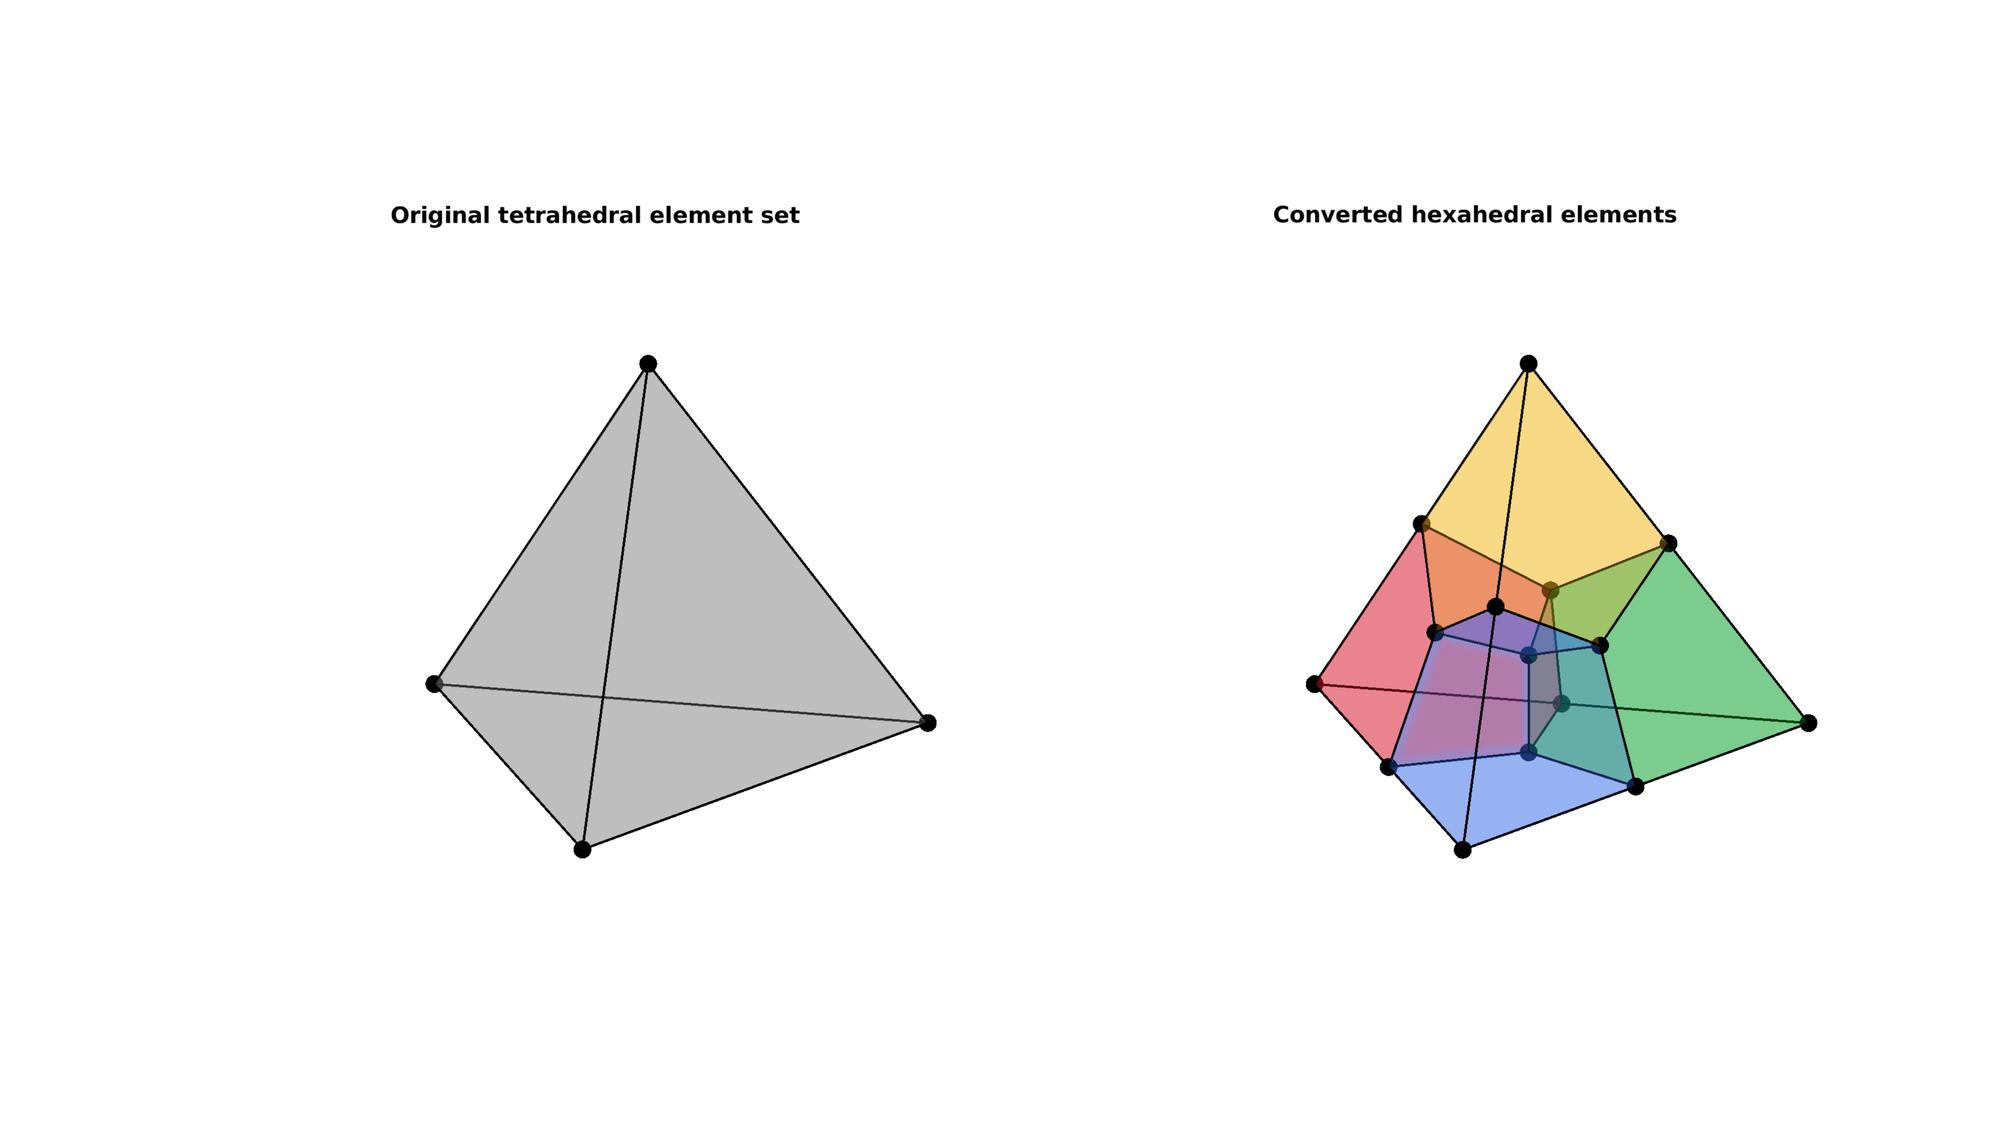
Example converting a single tetrahedron to 4 hexahedrons
Creating an example tetrahedron
[V,~]=platonic_solid(1,1);
E=[1:4];
Convert tetrahedron to hexahedral elements
[Es,Vs]=tet2hex(E,V);
Visualization
[F]=element2patch(E);  %Patch data for plotting

Cs=(1:1:size(Es,1))';
[Fs,CFs]=element2patch(Es,Cs); %Patch data for plotting

cFigure;
subplot(1,2,1);
title('Original tetrahedral element set','FontSize',fontSize);
hold on;

gpatch(F,V,0.5*ones(1,3),'k',faceAlpha,edgeWidth);
% hp=patchNormPlot(F,V);
plotV(V,'k.','MarkerSize',markerSize);
axisGeom(gca,fontSize); axis off;
view(-47,20);

subplot(1,2,2);
title('Converted hexahedral elements','FontSize',fontSize);
xlabel('X','FontSize',fontSize); ylabel('Y','FontSize',fontSize); zlabel('Z','FontSize',fontSize);
hold on;

gpatch(Fs,Vs,CFs,'k',faceAlpha,edgeWidth);
% hp=patchNormPlot(Fs,Vs);
plotV(Vs,'k.','MarkerSize',markerSize);
colormap(cMap);
axisGeom(gca,fontSize); axis off;
view(-47,20);
drawnow;
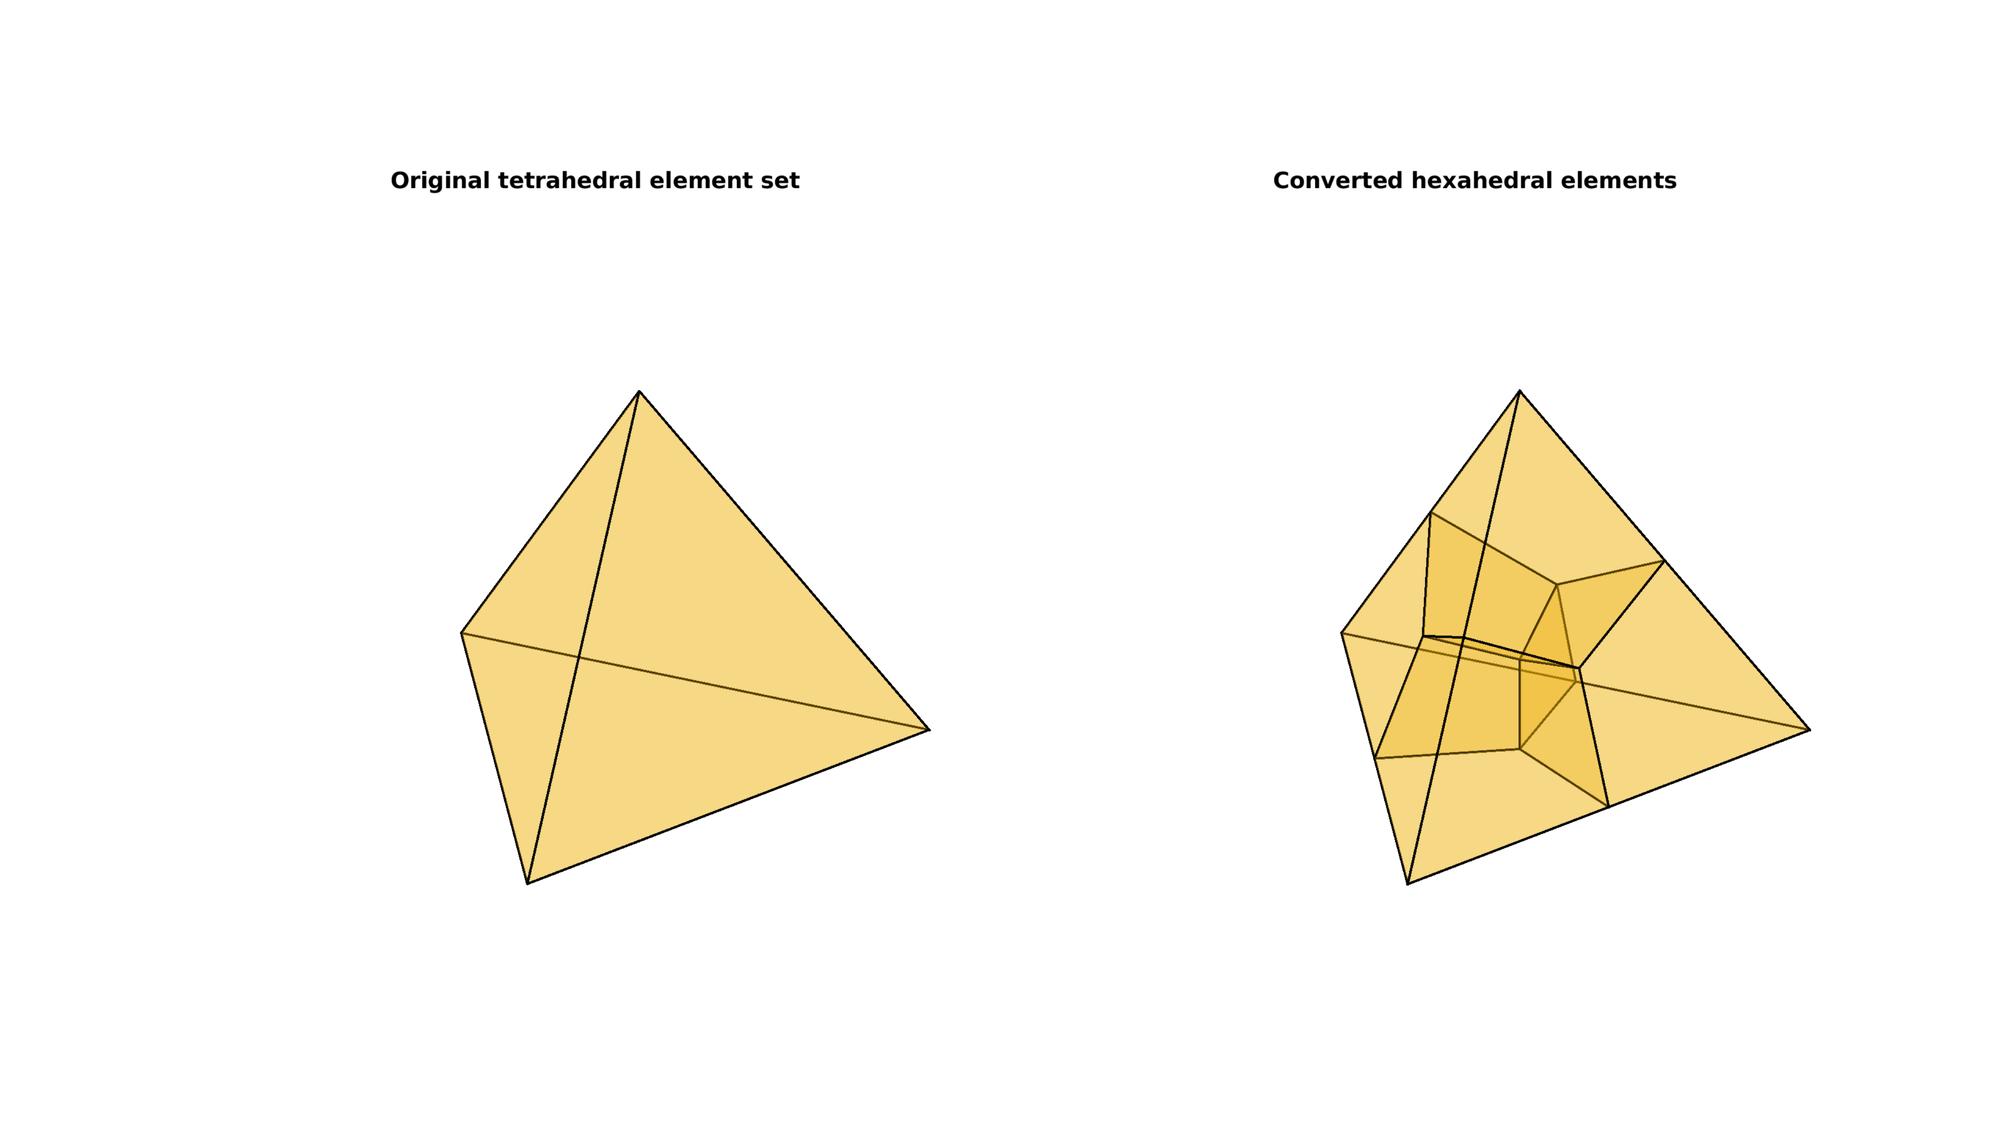
Example converting a set of tetrahedral elements
Creating an example set of hexahedrons
[V,~]=platonic_solid(1,1);
E=[1 2 4 3];

n=0;
if n>0
    for q=1:1:n
        [E,V]=subTet(E,V,1);
    end
end

C=(1:1:size(E,1))';
Subdeviding the hexahedral element
[Es,Vs]=tet2hex(E,V);
Visualization
[F,CF]=element2patch(E,C);  %Patch data for plotting

[Fs,CFs]=element2patch(Es,repmat(C,[4 1])); %Patch data for plotting

cFigure;
subplot(1,2,1);
title('Original tetrahedral element set','FontSize',fontSize);
hold on;

gpatch(F,V,CF,'k',faceAlpha,edgeWidth);
% hp=patchNormPlot(F,V);
axisGeom(gca,fontSize); axis off;

subplot(1,2,2);
title('Converted hexahedral elements','FontSize',fontSize);
xlabel('X','FontSize',fontSize); ylabel('Y','FontSize',fontSize); zlabel('Z','FontSize',fontSize);
hold on;

gpatch(Fs,Vs,CFs,'k',faceAlpha,edgeWidth);
% hp=patchNormPlot(Fs,Vs);
colormap(cMap);
axisGeom(gca,fontSize); axis off;

drawnow;

GIBBON www.gibboncode.org
Kevin Mattheus Moerman, [email protected]
GIBBON footer text
License: https://github.com/gibbonCode/GIBBON/blob/master/LICENSE
GIBBON: The Geometry and Image-based Bioengineering add-On. A toolbox for image segmentation, image-based modeling, meshing, and finite element analysis.
Copyright (C) 2019 Kevin Mattheus Moerman
This program is free software: you can redistribute it and/or modify it under the terms of the GNU General Public License as published by the Free Software Foundation, either version 3 of the License, or (at your option) any later version.
This program is distributed in the hope that it will be useful, but WITHOUT ANY WARRANTY; without even the implied warranty of MERCHANTABILITY or FITNESS FOR A PARTICULAR PURPOSE. See the GNU General Public License for more details.
You should have received a copy of the GNU General Public License along with this program. If not, see http://www.gnu.org/licenses/.