tet4_tet10
Below is a demonstration of the features of the tet4_tet10 function
Contents
Syntax
[E_tet10,V_tet10,V_tet10_cell,Fb_tet10,Fb_tet10_tri6]=tet4_tet10(E_tet4,V_tet4,V_tet4_cell,Fb_tet4);
Description
The tet4_tet10 converts 4-node tetrahedral elements to 10-node tetrahedral elements.
Examples
clear; close all; clc;

% Plot settings
fontSize=15;
faceAlpha=0.5;
edgeColor='k';
edgeWidth1=2;
edgeWidth2=1;
markerSize1=75;
markerSize2=10;
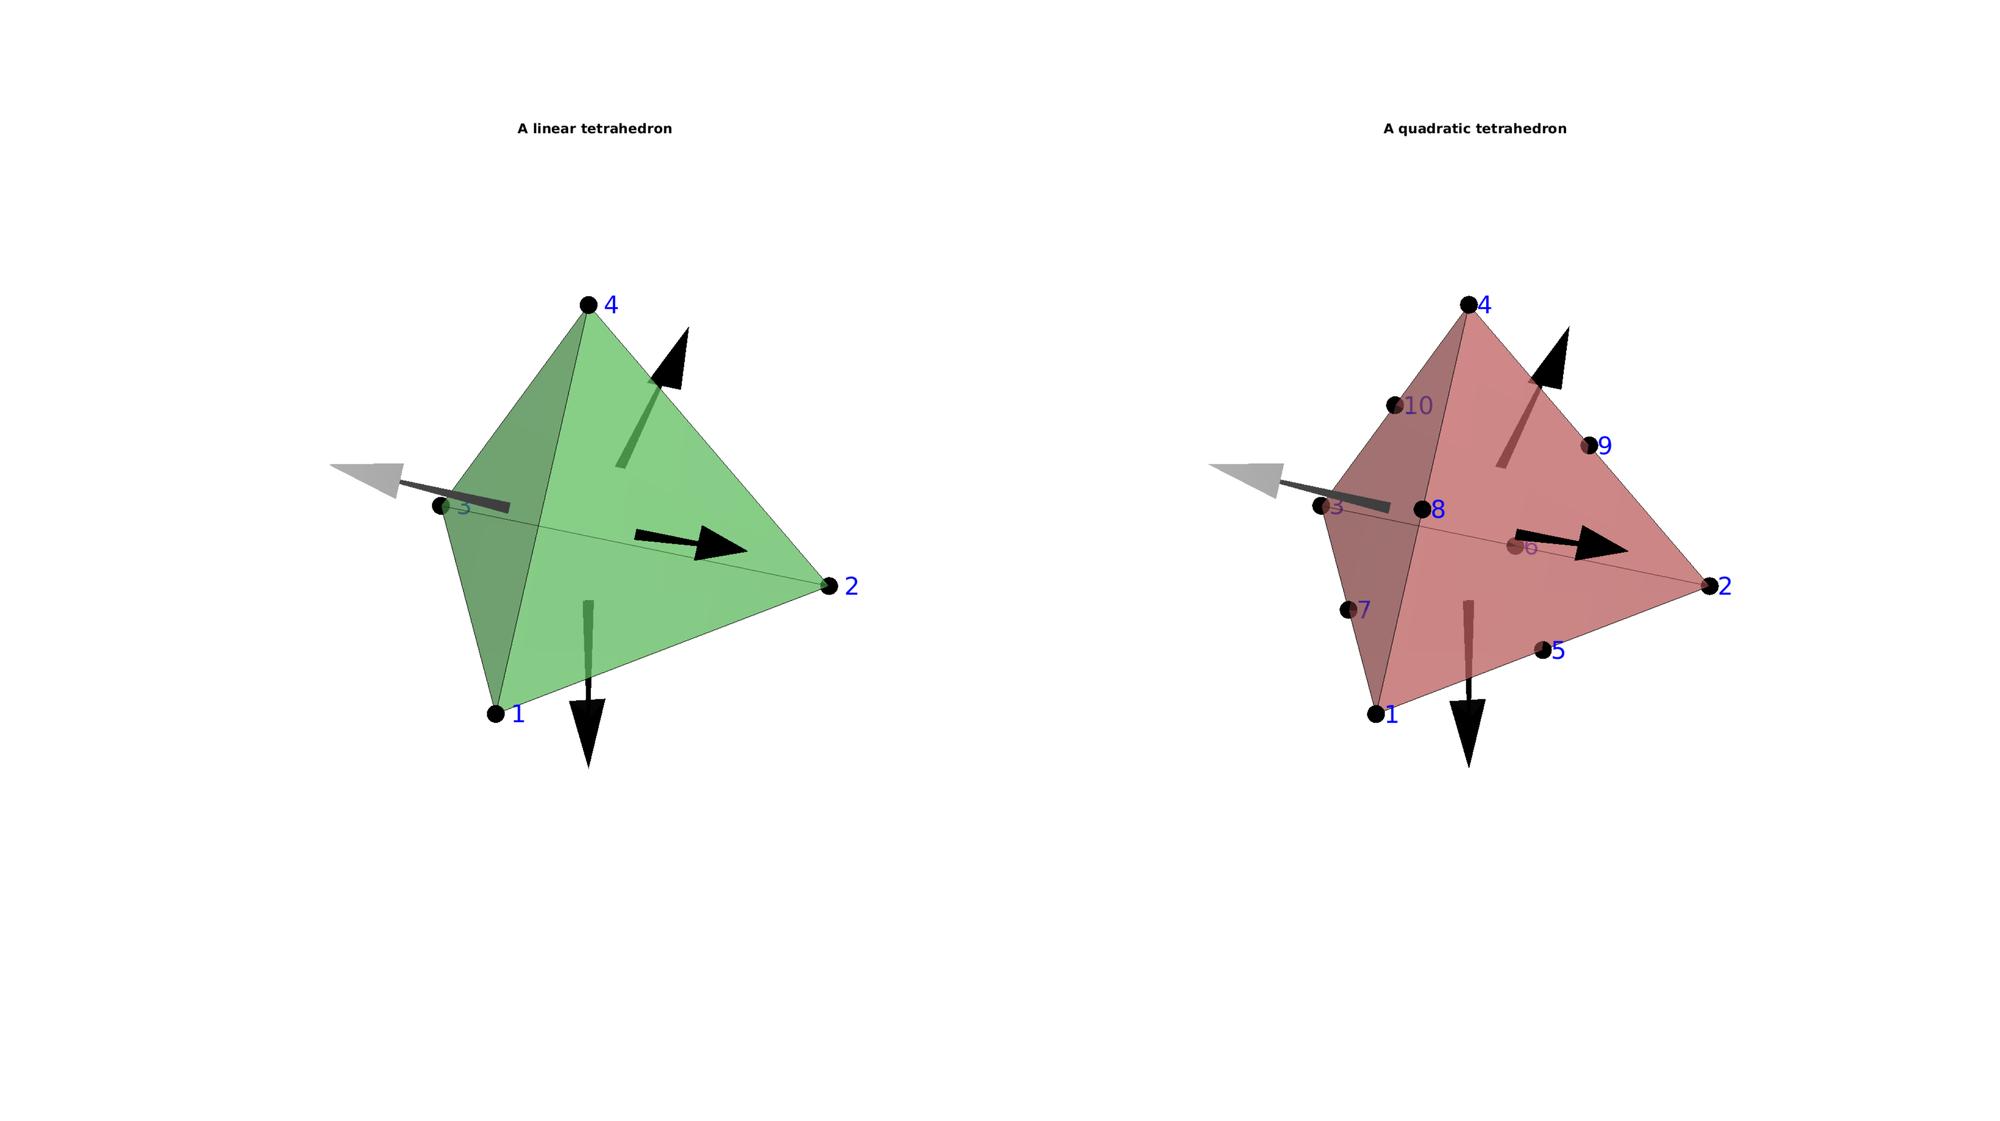
CONVERSION FROM TET4 TO TET10, EXAMPLE FOR A SINGLE TETRAHEDRON
Creating a single 4-node tetrahedron
[V4,~]=platonic_solid(1,1); %q indicates solid type, r is the radius
TET4=[1 2 4 3];
[F4,~]=element2patch(TET4,[],'tet4');
Converting to a single 10-node tetrahedron
[TET10,V10,~]=tet4_tet10(TET4,V4,{});
[F10,~]=element2patch(TET10,[],'tet10');
Plotting elements
cFigure;
subplot(1,2,1); hold on;
title('A linear tetrahedron','FontSize',fontSize);

hp=gpatch(F4,V4,'gw','k',faceAlpha);
hp.Marker='.';
hp.MarkerSize=markerSize1;

patchNormPlot(F4,V4,0.75); %Plotting face normals

for q=1:1:size(TET4,2)
    text(V4(TET4(1,q),1),V4(TET4(1,q),2),V4(TET4(1,q),3),['  ',num2str(q)],'FontSize',fontSize*2,'color','b');
end

axisGeom(gca,fontSize);
axis off;
camlight('headlight'); lighting flat;

subplot(1,2,2); hold on;
title('A quadratic tetrahedron','FontSize',fontSize);

hp=gpatch(F10,V10,'rw','k',faceAlpha);
hp.Marker='.';
hp.MarkerSize=markerSize1;
patchNormPlot(F10,V10,0.75); %Plotting face normals

for q=1:1:size(TET10,2)
    text(V10(TET10(1,q),1),V10(TET10(1,q),2),V10(TET10(1,q),3),[' ',num2str(q)],'FontSize',fontSize*2,'color','b');
end

axisGeom(gca,fontSize);
axis off;
camlight('headlight'); lighting flat;

drawnow;
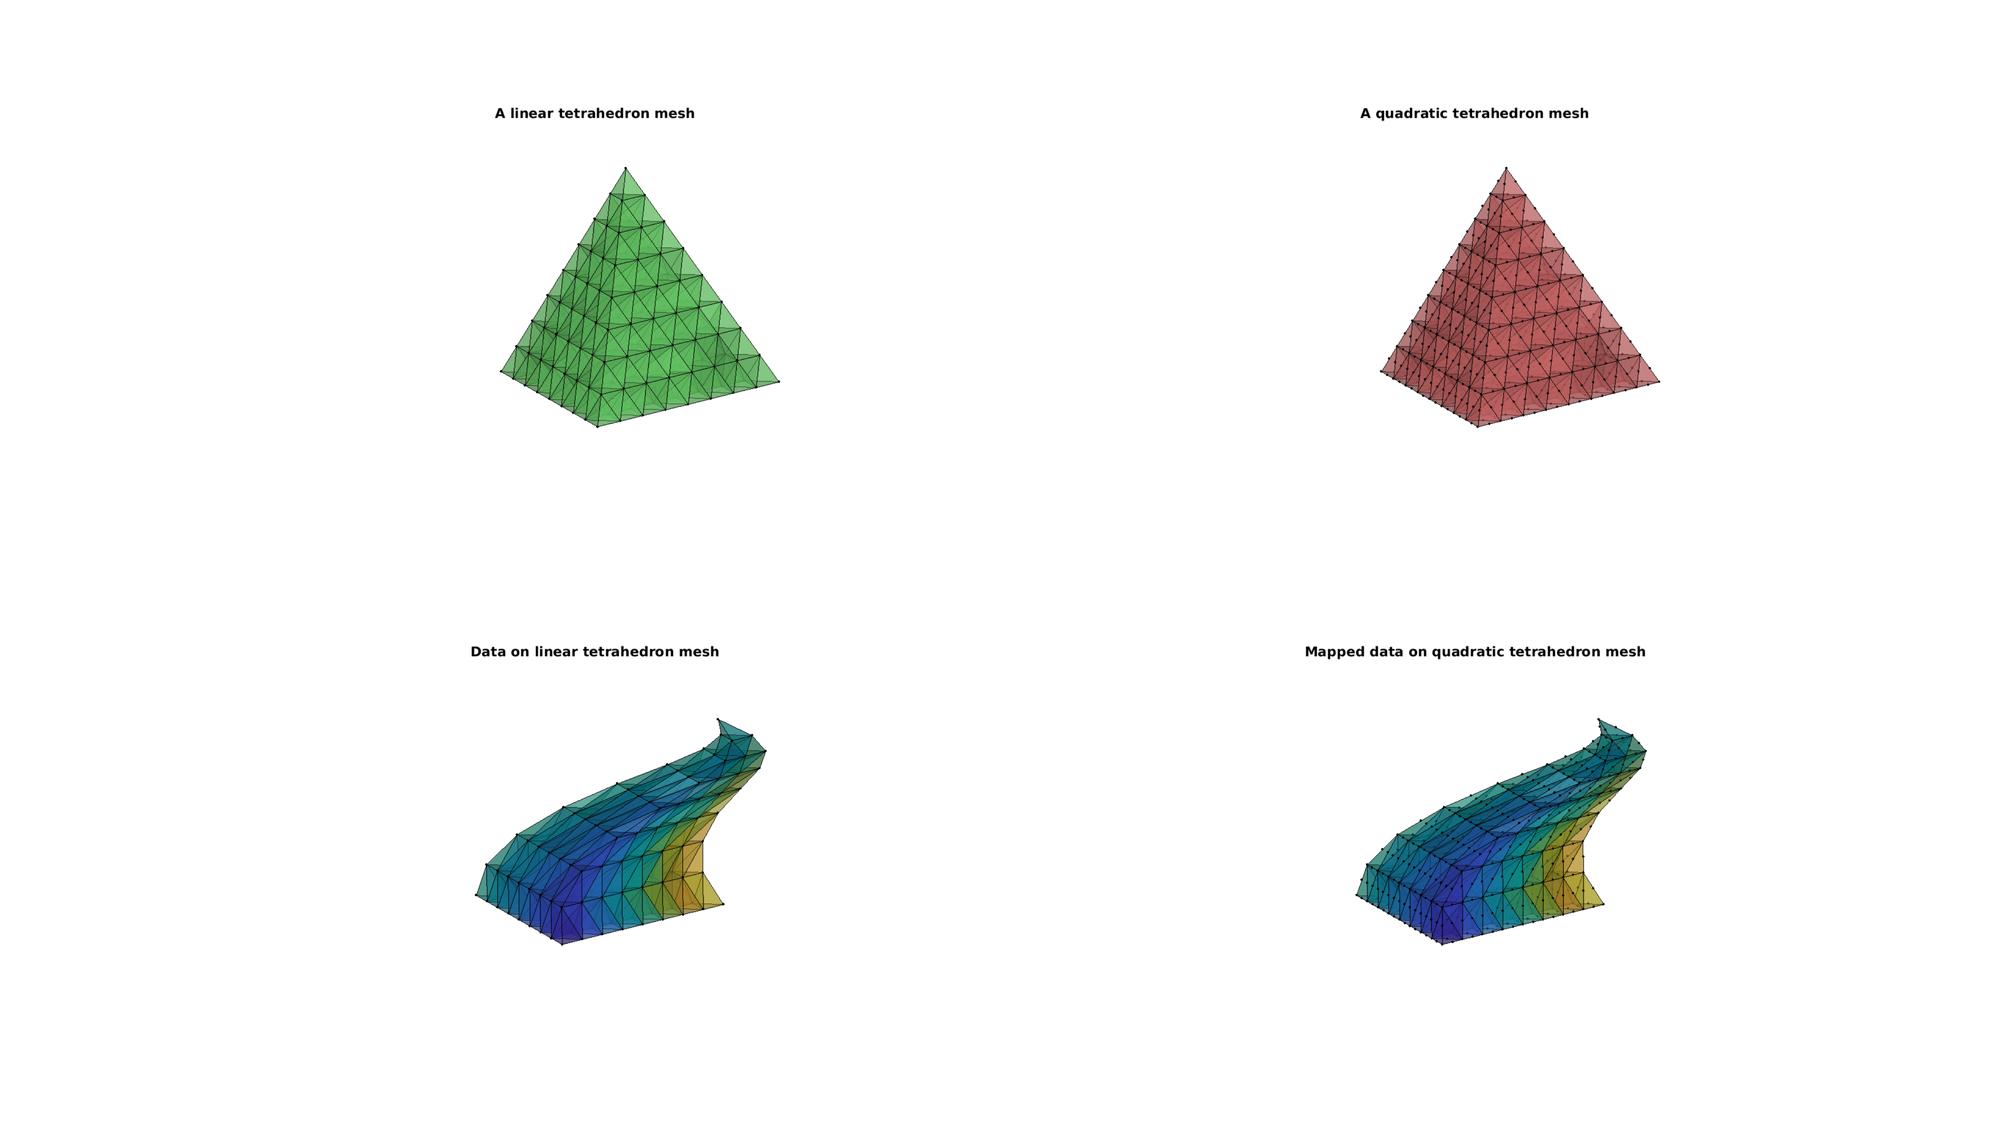
CONVERSION FROM TET4 TO TET10, EXAMPLE FOR A TETRAHEDRON MESH WITH NODAL PARAMETERS
n=3;
for q=1:1:n
    [TET4,V4]=subTet(TET4,V4,1);
end

[F4,~]=element2patch(TET4,[],'tet4');

%Create nodal result e.g. displacement and color
V4d=V4;
V4d(:,1)=V4d(:,1)+0.5.*sin(pi*V4d(:,3));
V4d(:,2)=V4d(:,2)+0.5.*cos(pi*V4d(:,3));
D4=V4d-V4;

C4=V4(:,1); %Color towards X
Converting to a single 10-node tetrahedron
tet4_cell={D4,C4};
[TET10,V10,tet10_cell]=tet4_tet10(TET4,V4,tet4_cell);
[F10,~]=element2patch(TET10,[],'tet10');
D10=tet10_cell{1};
C10=tet10_cell{2};
V10d=V10+D10;
Plotting elements
hf=cFigure; % Open figure for plotting
subplot(2,2,1); hold on;
title('A linear tetrahedron mesh','FontSize',fontSize);

hp=gpatch(F4,V4,'gw','k',faceAlpha);
hp.Marker='.';
hp.MarkerSize=markerSize2;

axisGeom(gca,fontSize); axis off;
view([-50,12])
camlight('headlight'); lighting flat;

subplot(2,2,3); hold on;
title('Data on linear tetrahedron mesh','FontSize',fontSize);

hp=gpatch(F4,V4d,C4,'k',faceAlpha);
hp.Marker='.';
hp.MarkerSize=markerSize2;

axisGeom(gca,fontSize); axis off;
view([-50,12])
camlight('headlight'); lighting flat;

subplot(2,2,2); hold on;
title('A quadratic tetrahedron mesh','FontSize',fontSize);

hp=gpatch(F10,V10,'rw','k',faceAlpha);
hp.Marker='.';
hp.MarkerSize=markerSize2;

axisGeom(gca,fontSize); axis off;
view([-50,12])
camlight('headlight'); lighting flat;

subplot(2,2,4); hold on;
title('Mapped data on quadratic tetrahedron mesh','FontSize',fontSize);

hp=gpatch(F10,V10d,C10,'k',faceAlpha);
hp.Marker='.';
hp.MarkerSize=markerSize2;

axisGeom(gca,fontSize); axis off;
view([-50,12])
camlight('headlight'); lighting flat;

drawnow;
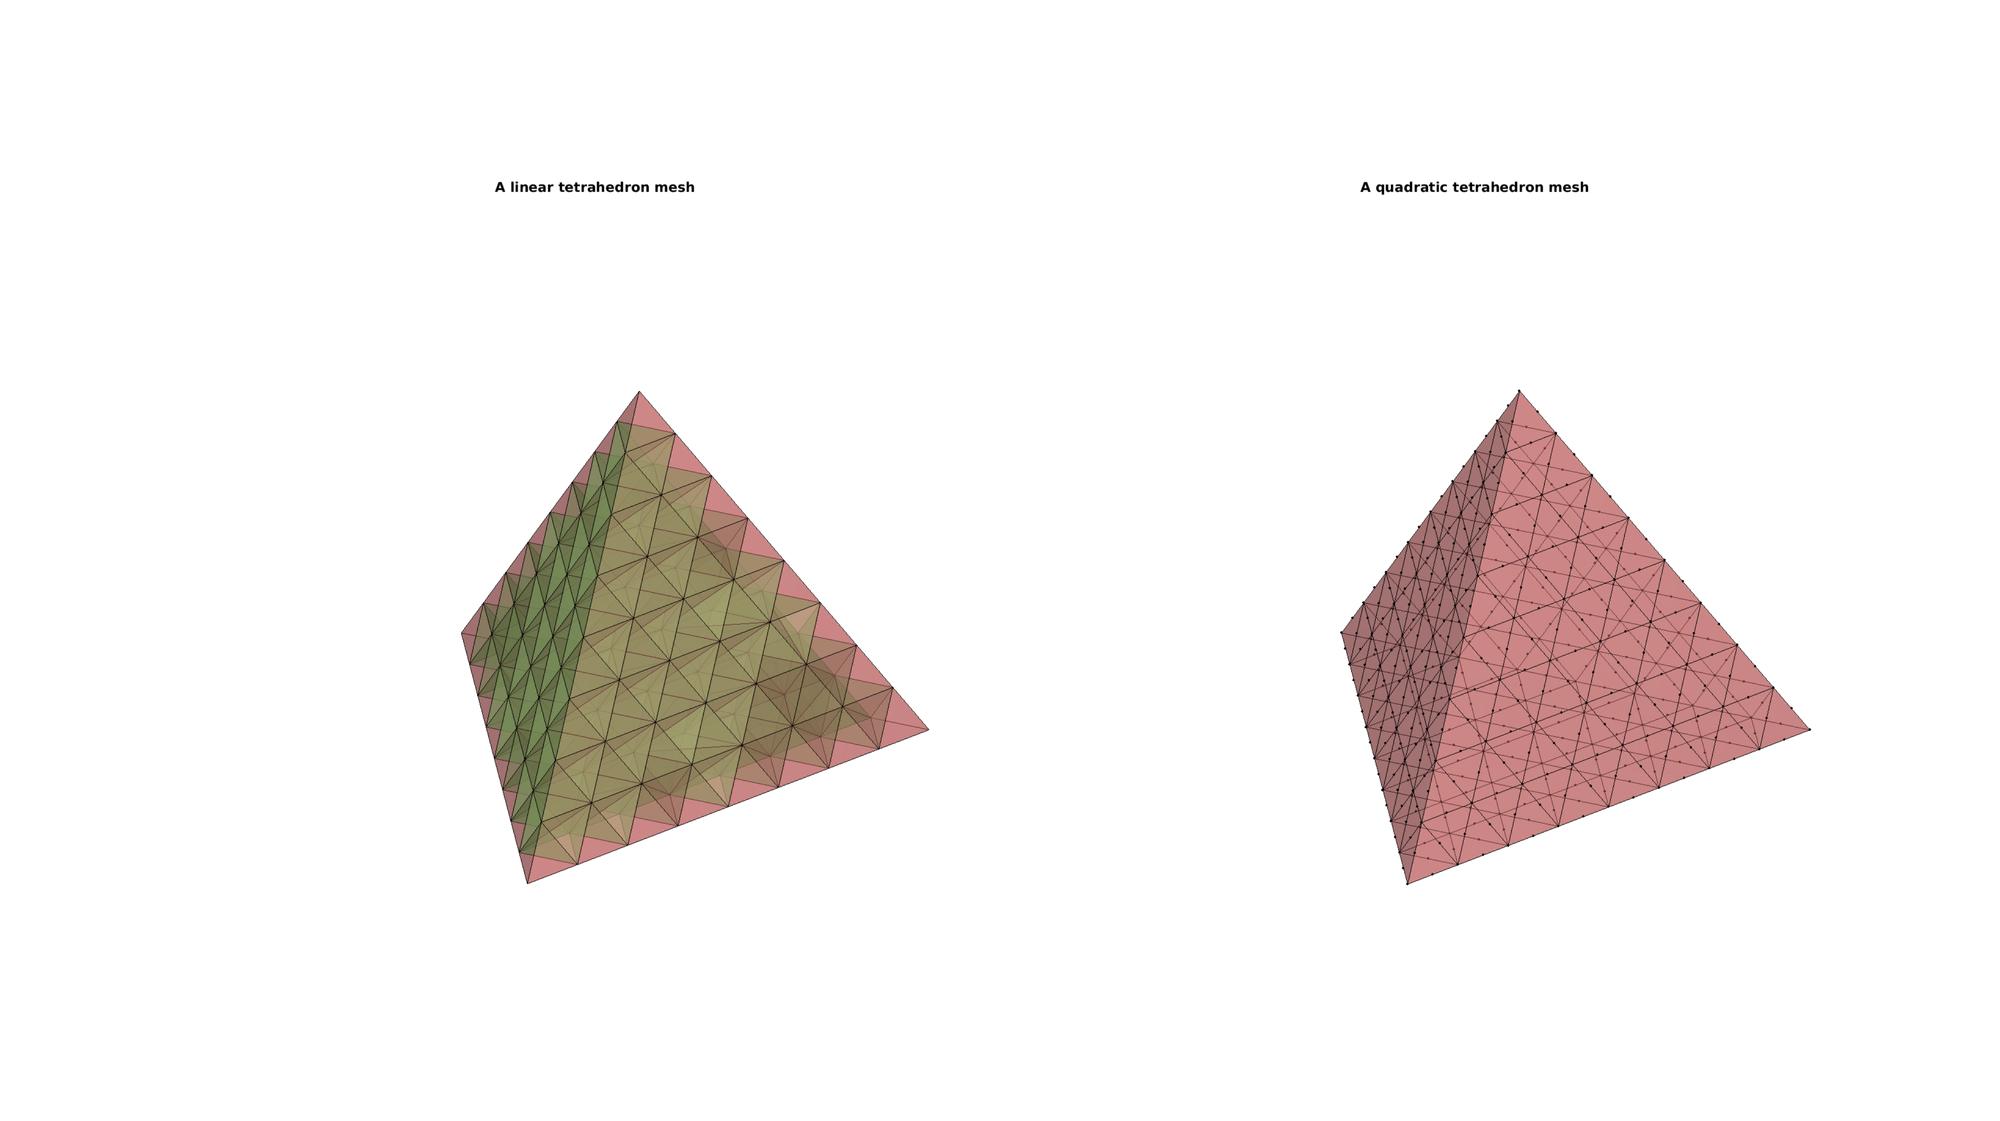
CONVERSION FROM TET4 TO TET10, EXAMPLE FOR KEEPING TRACK OF BOUNDARY FACES
[F4,~]=element2patch(TET4,[],'tet4');
[indBoundary]=tesBoundary(F4,V4);
Fb4=F4(indBoundary,:);

[TET10,V10,tet10_cell,Fb10]=tet4_tet10(TET4,V4,{},Fb4);
[F10,~]=element2patch(TET10,[],'tet10');

% [indBoundary]=tesBoundary(F10,V10);
% Fb10=F10(indBoundary,:);
hf=cFigure; % Open figure for plotting
subplot(1,2,1); hold on;
title('A linear tetrahedron mesh','FontSize',fontSize);

gpatch(F4,V4,'gw','k',faceAlpha);

gpatch(Fb4,V4,'rw','k',faceAlpha);
axisGeom(gca,fontSize); axis off;
camlight('headlight'); lighting flat;

subplot(1,2,2); hold on;
title('A quadratic tetrahedron mesh','FontSize',fontSize);

hp=gpatch(Fb10,V10,'rw','k',faceAlpha);
hp.Marker='.';
hp.MarkerSize=markerSize2;

axisGeom(gca,fontSize); axis off;
camlight('headlight'); lighting flat;

drawnow;

GIBBON www.gibboncode.org
Kevin Mattheus Moerman, [email protected]
GIBBON footer text
License: https://github.com/gibbonCode/GIBBON/blob/master/LICENSE
GIBBON: The Geometry and Image-based Bioengineering add-On. A toolbox for image segmentation, image-based modeling, meshing, and finite element analysis.
Copyright (C) 2019 Kevin Mattheus Moerman
This program is free software: you can redistribute it and/or modify it under the terms of the GNU General Public License as published by the Free Software Foundation, either version 3 of the License, or (at your option) any later version.
This program is distributed in the hope that it will be useful, but WITHOUT ANY WARRANTY; without even the implied warranty of MERCHANTABILITY or FITNESS FOR A PARTICULAR PURPOSE. See the GNU General Public License for more details.
You should have received a copy of the GNU General Public License along with this program. If not, see http://www.gnu.org/licenses/.