triplyPeriodicMinimal
Below is a demonstration of the features of the triplyPeriodicMinimal function
Contents
clear; close all; clc;
Syntax
S=triplyPeriodicMinimal(X,Y,Z,typeStr);
Description
This function creates the image S which can be used to define triply periodic minimal surfaces. The input consists of a grid of coordinates (X,Y,Z) and the surface type (typeStr).
Examples
clear; close all; clc;
Plot settings
cMap=jet(250);
faceAlpha1=1;
faceAlpha2=0.65;
edgeColor1='none';
edgeColor2='none';
fontSize=25;
pColors=gjet(6);
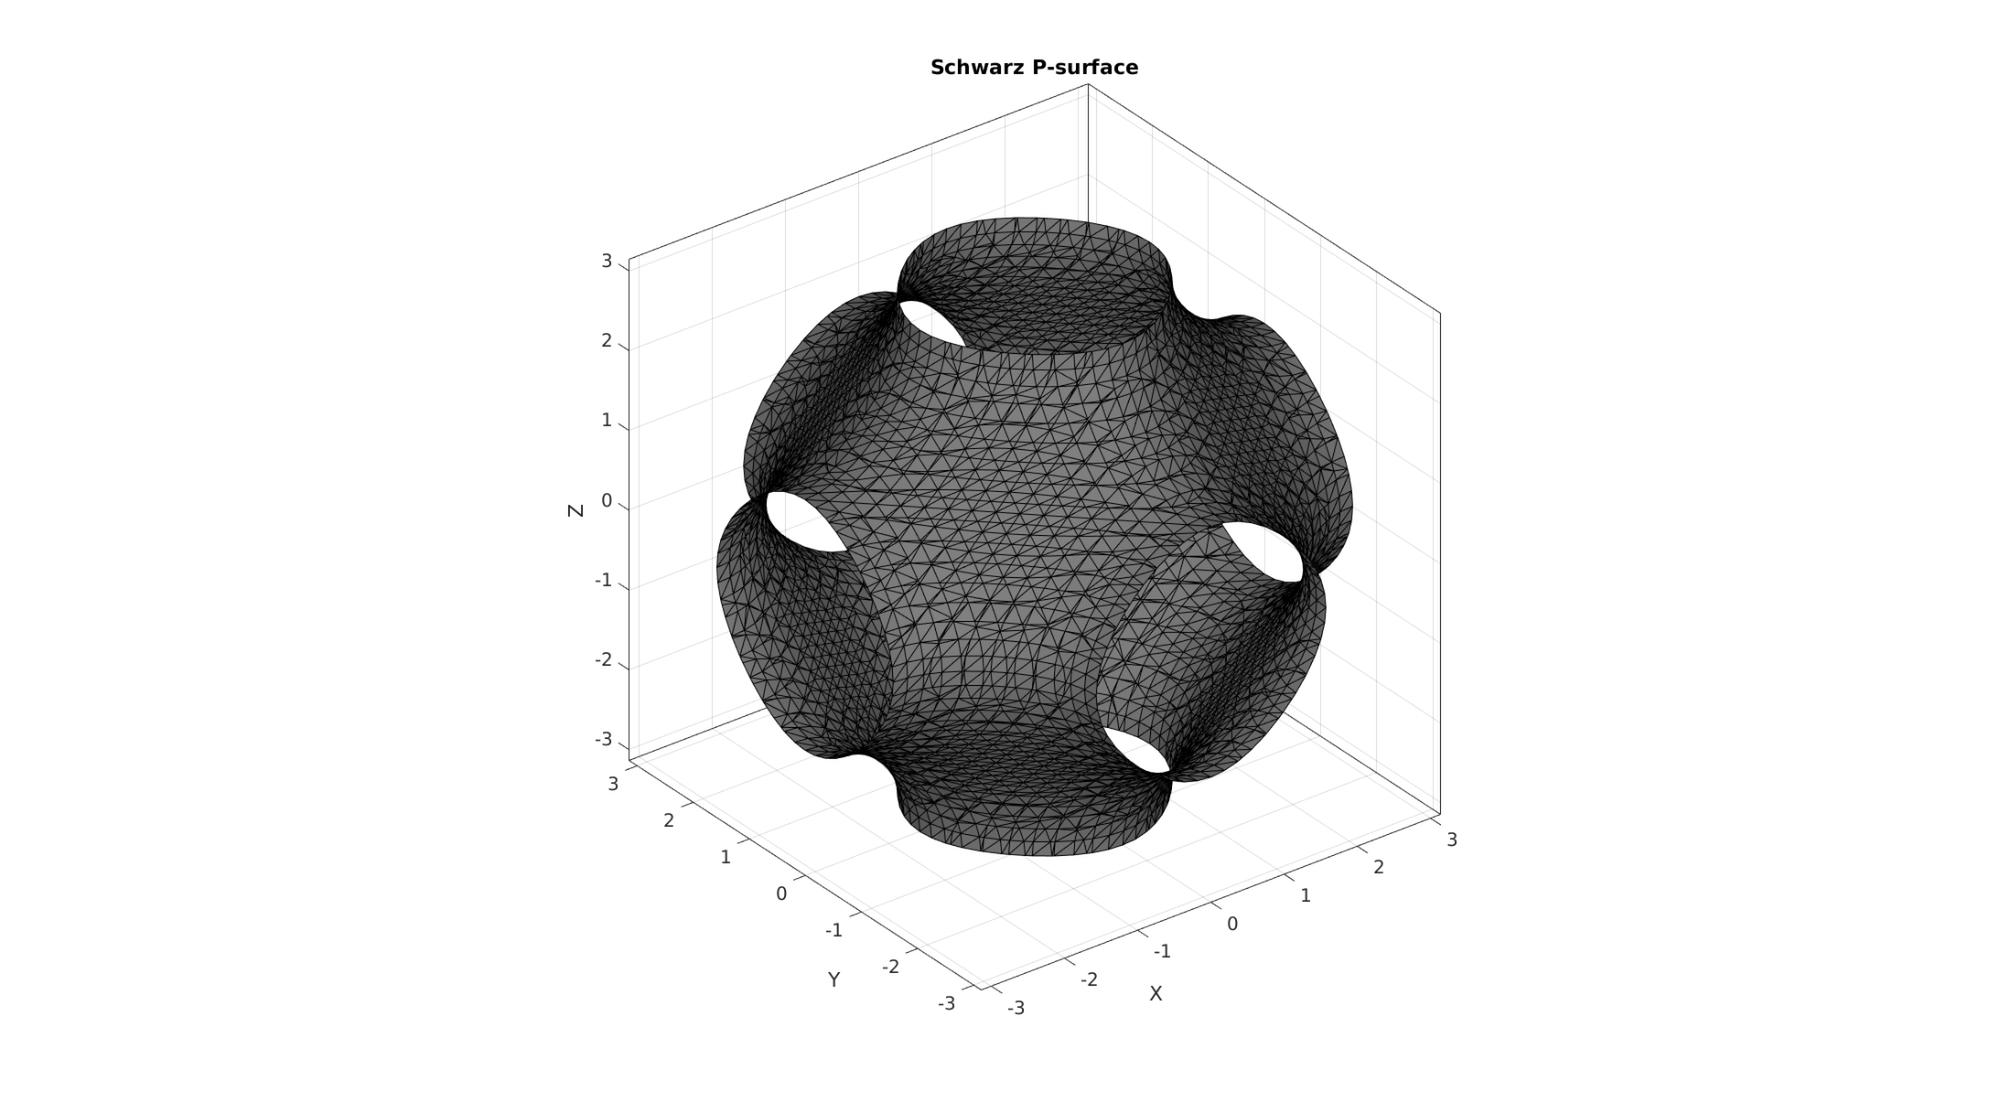
Example: Construct triply periodic minimal surfaces
%Create a grid
n=35;
[X,Y,Z]=meshgrid(linspace(-pi,pi,n));

%Evaluate triply periodic function
S=triplyPeriodicMinimal(X,Y,Z,'p');

%Construct iso-surface
[F,V] = isosurface(X,Y,Z,S,0);
Visualize surface
cFigure;
hold on;
title('Schwarz P-surface','FontSize',fontSize);
gpatch(F,V,'kw','k',1);
axisGeom;
camlight headlight;
drawnow;
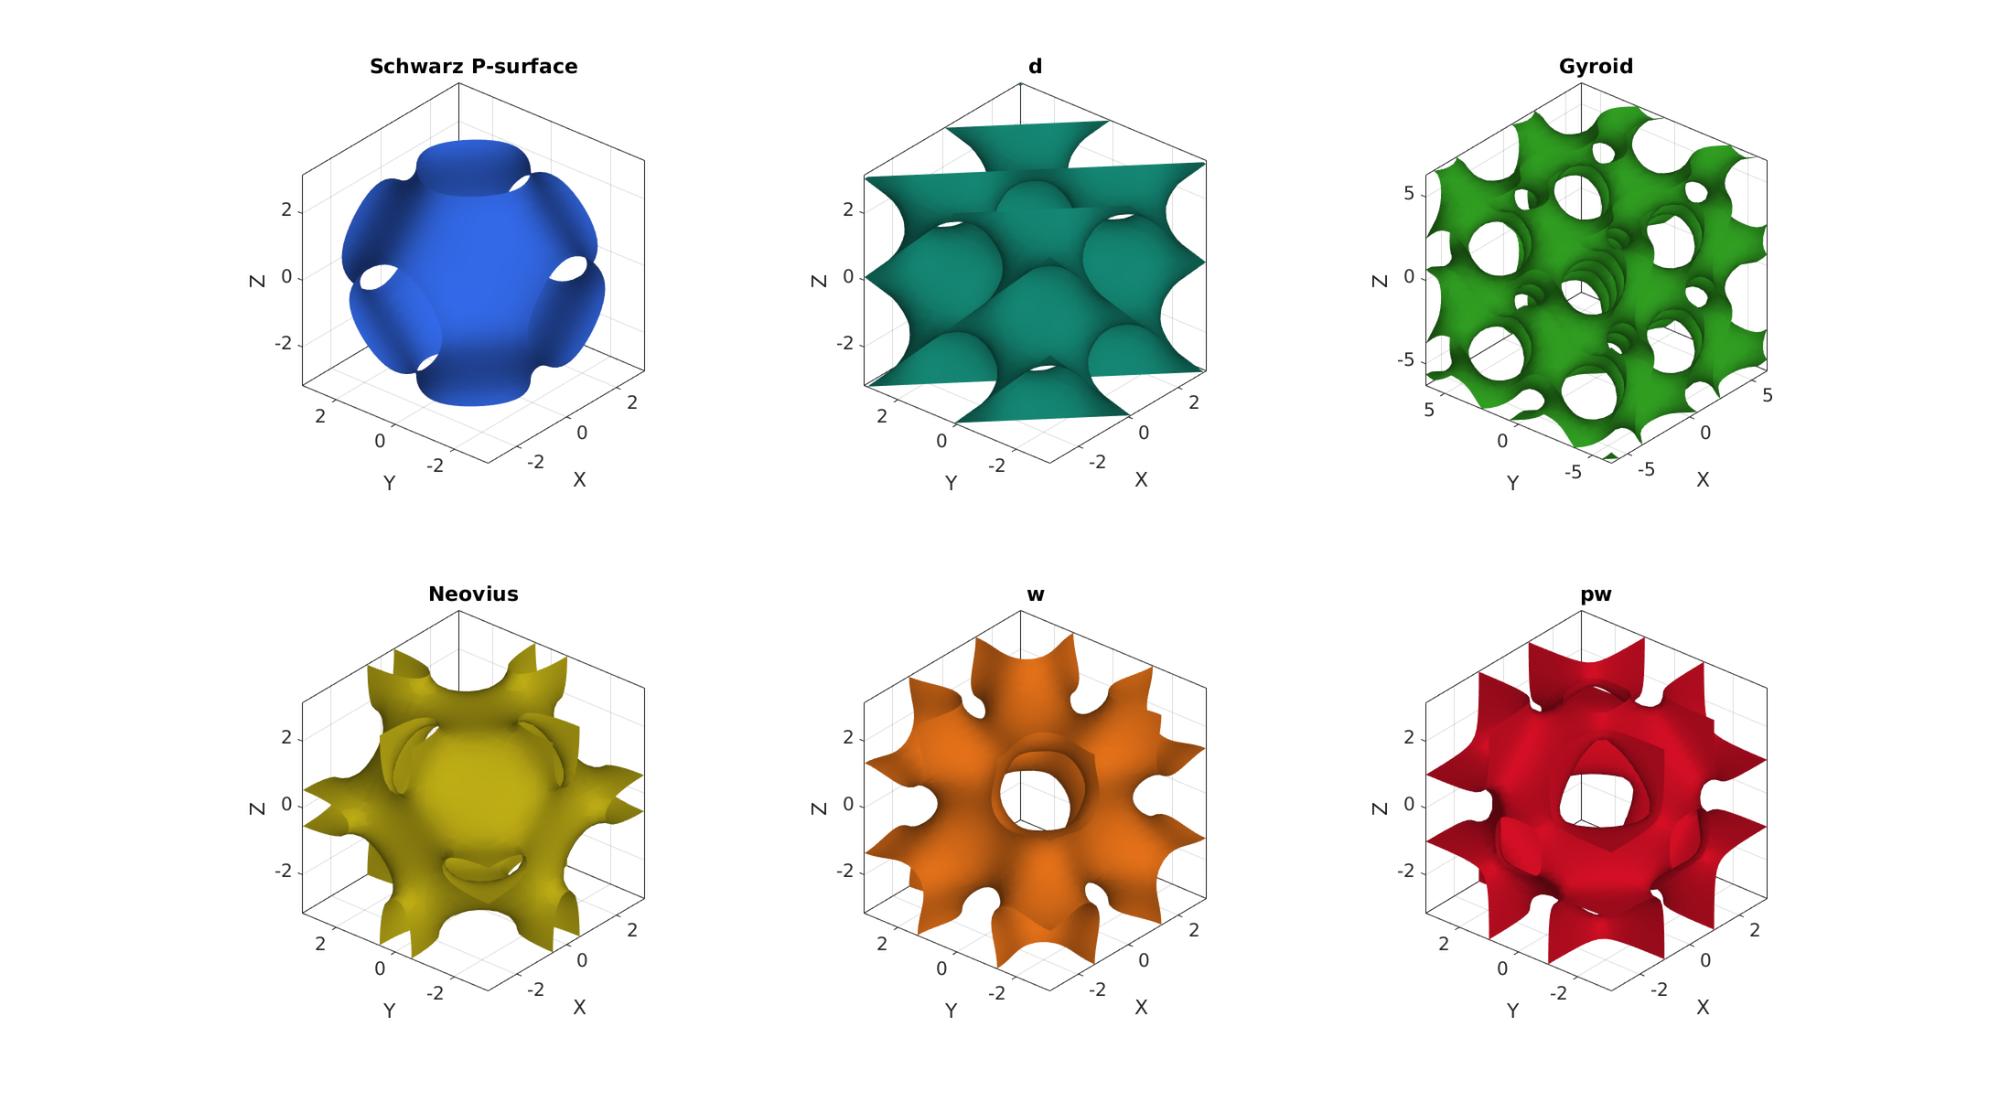
Visualization all variations
cFigure;

subplot(2,3,1);
title('Schwarz P-surface','FontSize',fontSize);
hold on;
gpatch(F,V,pColors(1,:),'none',1);
axisGeom;
camlight headlight; lighting gouraud;
view(-50,30);

[X,Y,Z]=meshgrid(linspace(-pi,pi,n));
S=triplyPeriodicMinimal(X,Y,Z,'d');
[F,V] = isosurface(X,Y,Z,S,0.1);

subplot(2,3,2);
title('d','FontSize',fontSize);
hold on;
gpatch(F,V,pColors(2,:),'none',1);
axisGeom;
camlight headlight; lighting gouraud;
view(-50,30);

[X,Y,Z]=meshgrid(linspace(-2*pi,2*pi,n));
S=triplyPeriodicMinimal(X,Y,Z,'g');
[F,V] = isosurface(X,Y,Z,S,0.6);

subplot(2,3,3);
title('Gyroid','FontSize',fontSize);
hold on;
gpatch(F,V,pColors(3,:),'none',1);
axisGeom;
camlight headlight; lighting gouraud;
view(-50,30);

[X,Y,Z]=meshgrid(linspace(-pi,pi,n));
S=triplyPeriodicMinimal(X,Y,Z,'n');
[F,V] = isosurface(X,Y,Z,S,0);

subplot(2,3,4);
title('Neovius','FontSize',fontSize);
hold on;
gpatch(F,V,pColors(4,:),'none',1);
axisGeom;
camlight headlight; lighting gouraud;
view(-50,30);

[X,Y,Z]=meshgrid(linspace(-pi,pi,n));
S=triplyPeriodicMinimal(X,Y,Z,'w');
[F,V] = isosurface(X,Y,Z,S,0);

subplot(2,3,5);
title('w','FontSize',fontSize);
hold on;
gpatch(F,V,pColors(5,:),'none',1);
axisGeom;
camlight headlight; lighting gouraud;
view(-50,30);

[X,Y,Z]=meshgrid(linspace(-pi,pi,n));
S=triplyPeriodicMinimal(X,Y,Z,'pw');
[F,V] = isosurface(X,Y,Z,S,0.5);

subplot(2,3,6);
title('pw','FontSize',fontSize);
hold on;
gpatch(F,V,pColors(6,:),'none',1);
axisGeom;
camlight headlight; lighting gouraud;
view(-50,30);

drawnow;
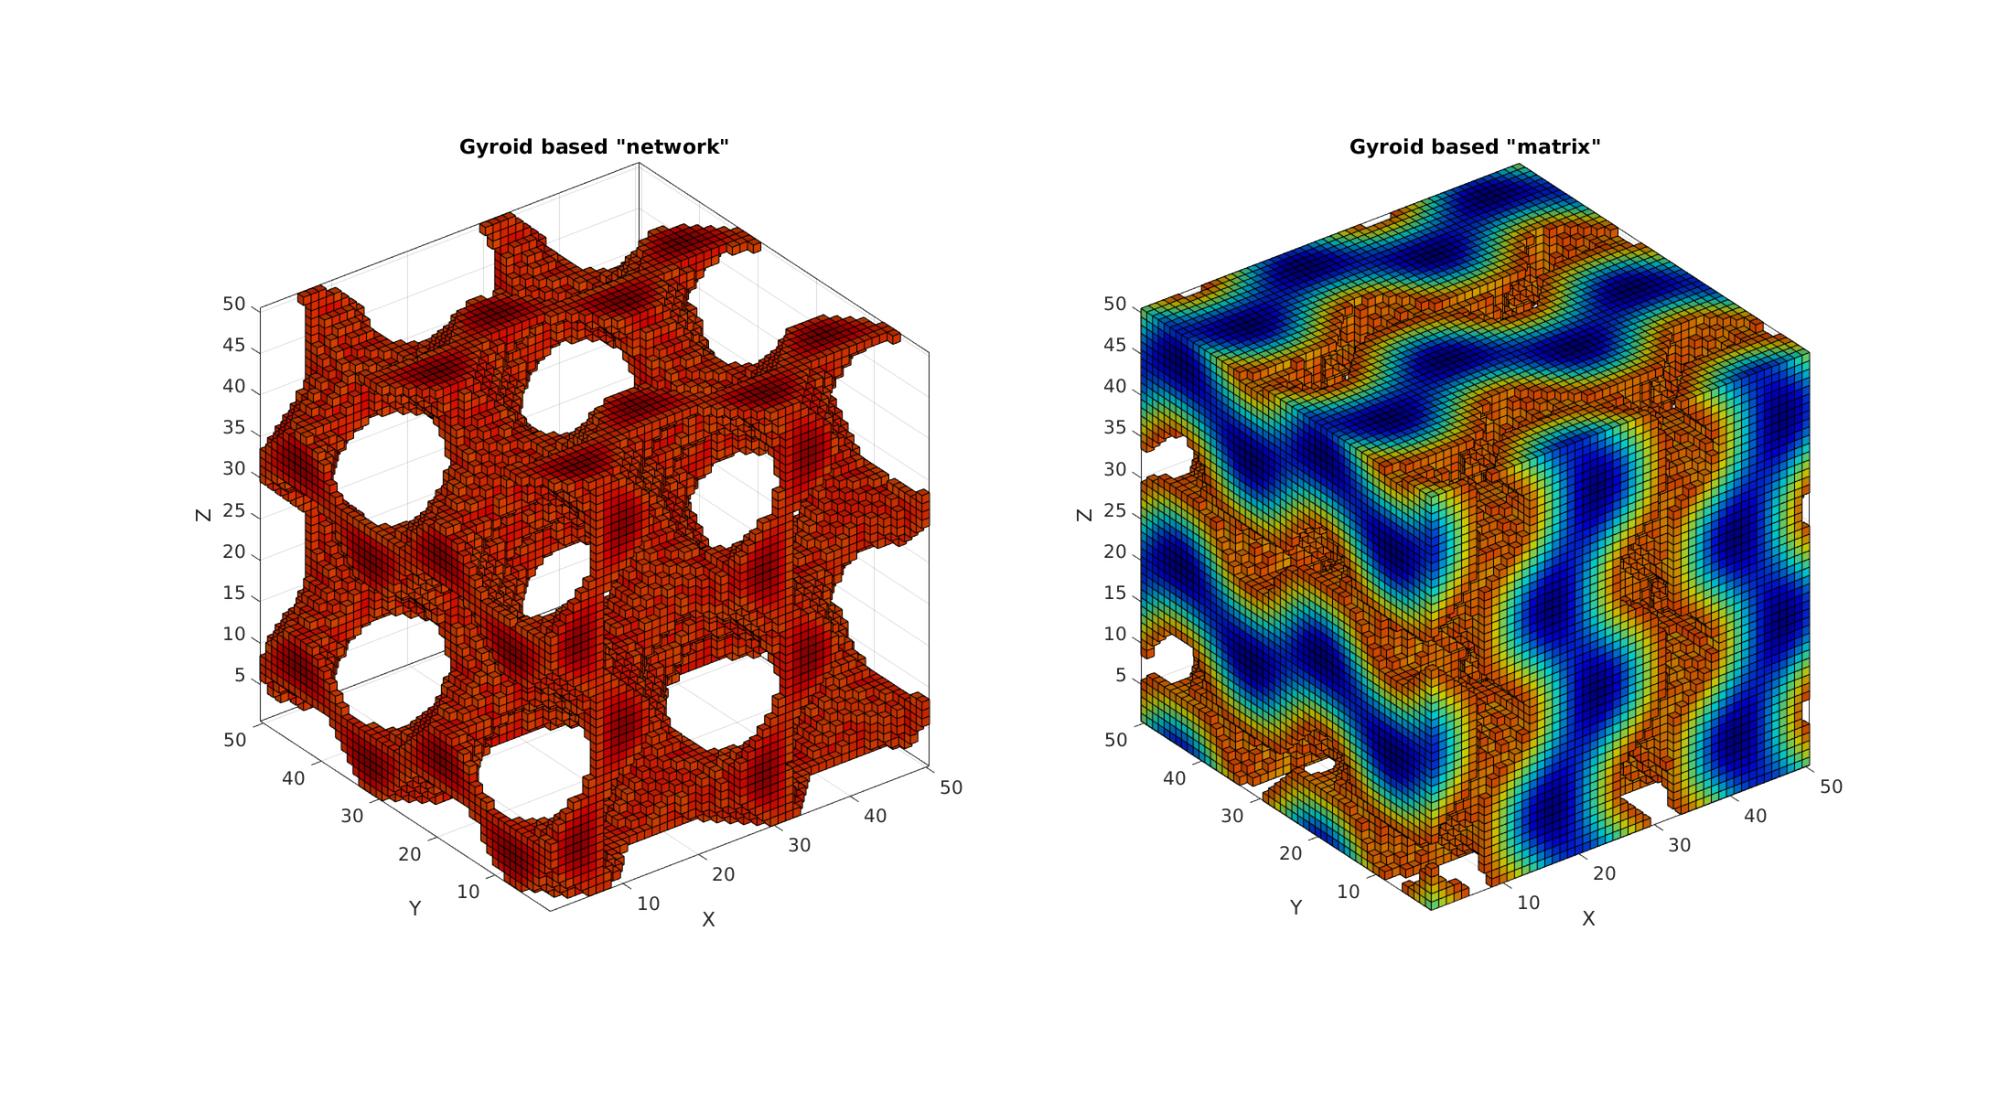
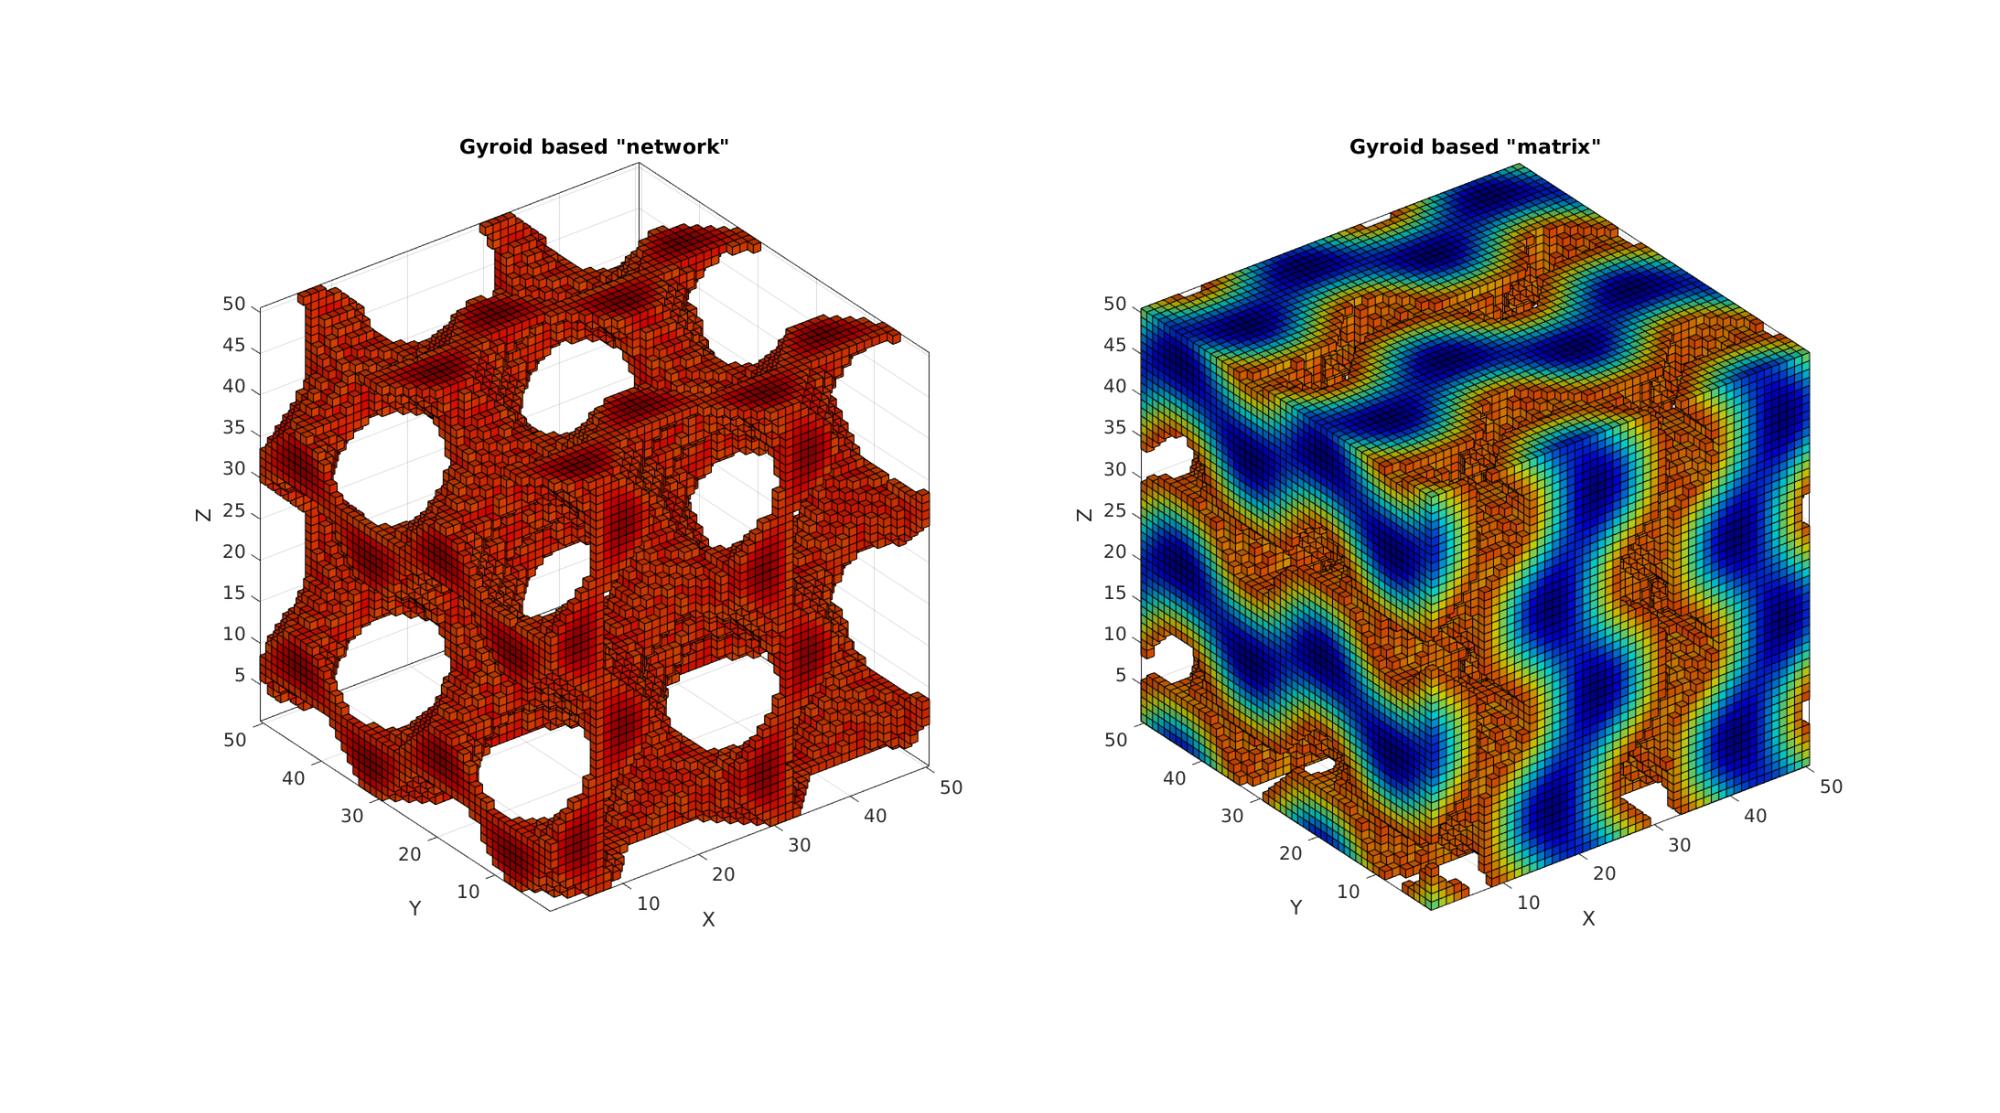
Example: Creating a hexahedral mesh of for a regular trabecular structure
This example renders boundary faces. Use the 'h' option for im2patch to obtain hexehadral elements.
n=50;
[X,Y,Z]=meshgrid(linspace(-2*pi,2*pi,n));
S=triplyPeriodicMinimal(X,Y,Z,'g');

T=0.6;
c=(max(S(:))*T);
L=S>=c;
[F1,V1,C1]=im2patch(S,L,'vb');

L=S<c;
[F2,V2,C2]=im2patch(S,L,'vb');
Visualization
cFigure;
subplot(1,2,1);
title('Gyroid based "network"','FontSize',fontSize);
xlabel('J','FontSize',fontSize);ylabel('I','FontSize',fontSize); zlabel('K','FontSize',fontSize); hold on;
gpatch(F1,V1,C1,'k',1);
axisGeom;
colormap(cMap);
caxis([min(S(:)) max(S(:))]);
camlight headlight;

subplot(1,2,2);
title('Gyroid based "matrix"','FontSize',fontSize);
xlabel('J','FontSize',fontSize);ylabel('I','FontSize',fontSize); zlabel('K','FontSize',fontSize); hold on;
gpatch(F2,V2,C2,'k',1);
axisGeom;
colormap(cMap);
caxis([min(S(:)) max(S(:))]);
camlight headlight;

drawnow;
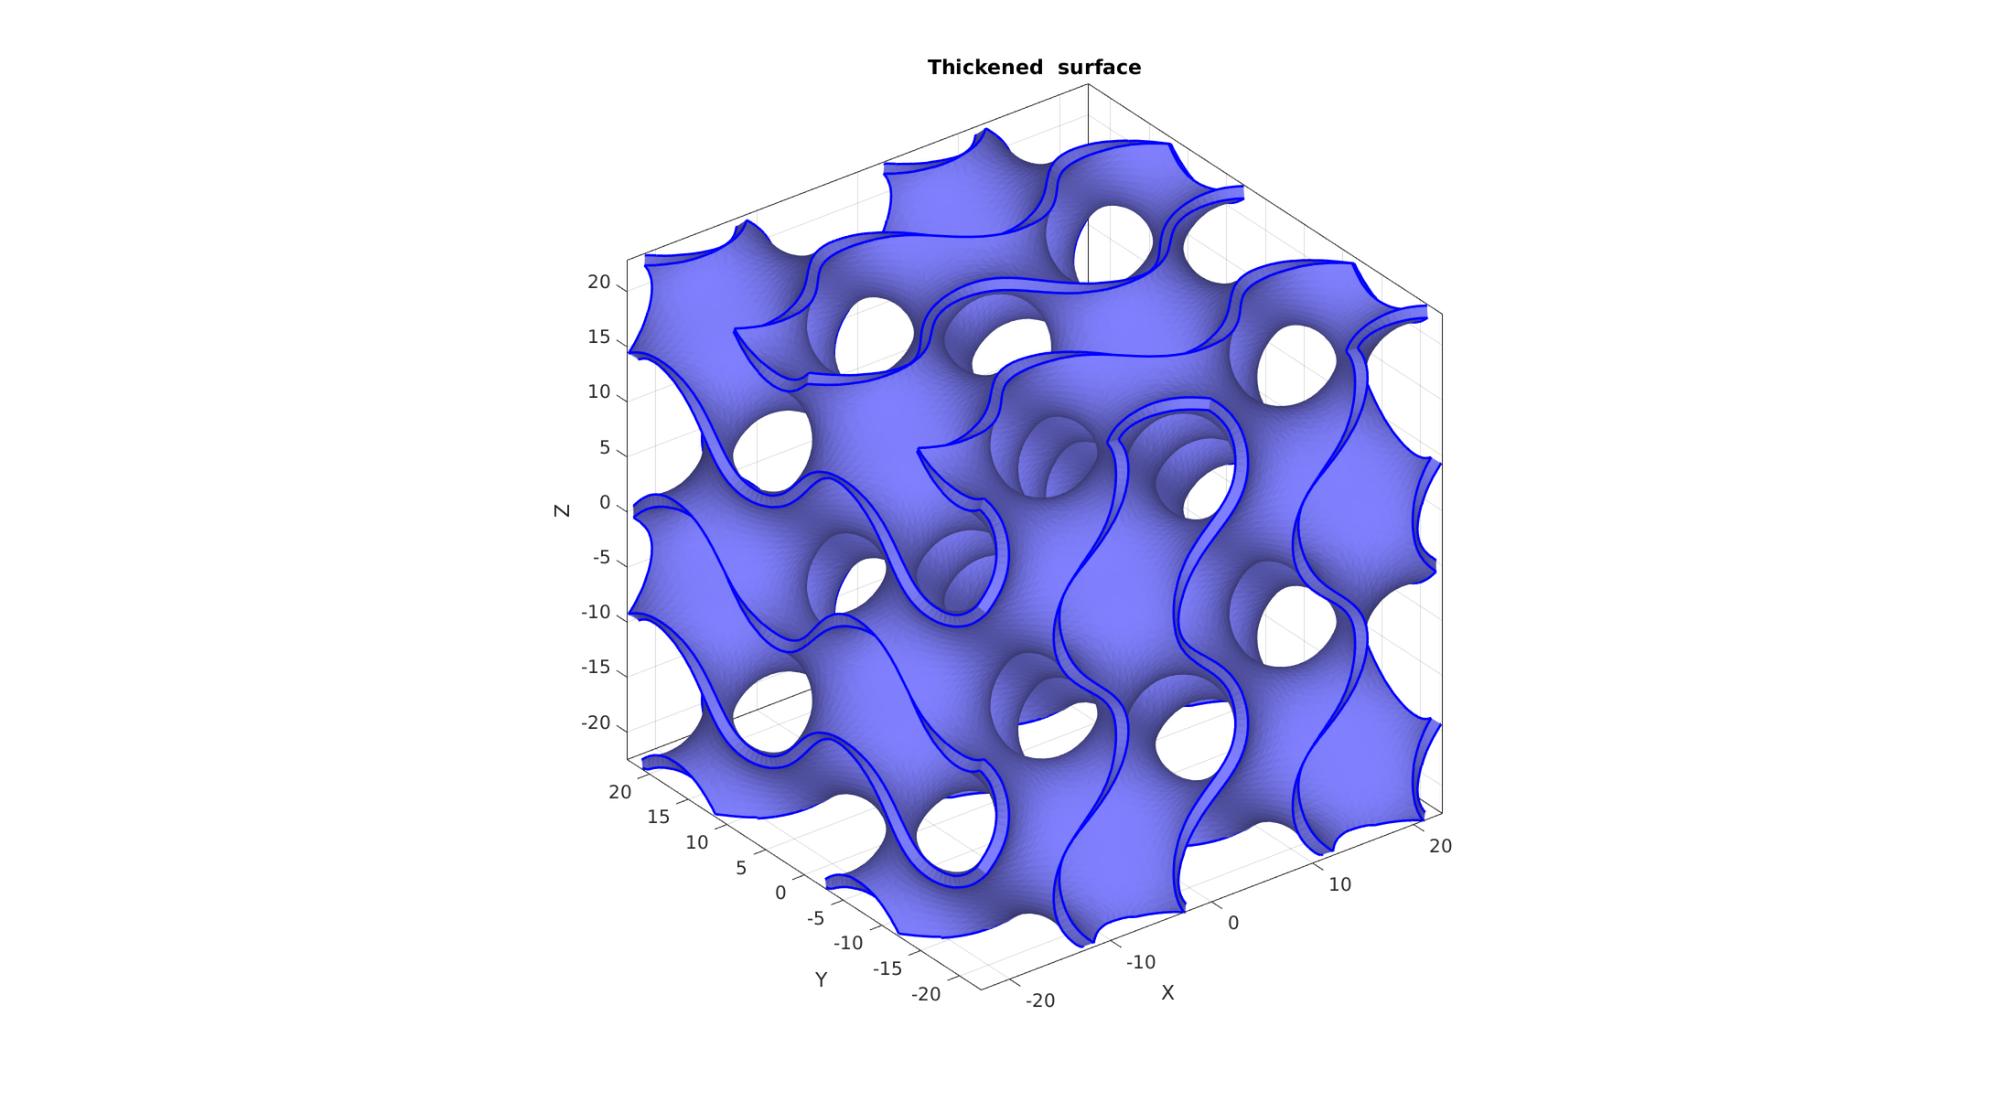
Example: Thickening the surfaces
n=75;
typeStr='g';
switch typeStr
    case 'p'
        [X,Y,Z]=meshgrid(linspace(-pi,pi,n));
        S=triplyPeriodicMinimal(X,Y,Z,'p');
        [F,V] = isosurface(X,Y,Z,S,0);
    case 'g'
        [X,Y,Z]=meshgrid(linspace(-1.9*pi,1.9*pi,n));
        S=triplyPeriodicMinimal(X,Y,Z,'g');
        [F,V] = isosurface(X,Y,Z,S,0);
        V=V./max(V(:)); %Normalize coordinates
        V=V*45/2;
end
F1=F; V1=V; %Store originals

%Get boundary edges
Eb=patchBoundary(F,V);

% %Smoothen surface
% controlPar.Method='HC';
% controlPar.n=5;
% controlPar.RigidConstraints=unique(Eb(:));
% V=patchSmooth(F,V,[],controlPar);
Thicken surface in ward
thicknessOffset=1; %The desired thickness
[~,~,N]=patchNormal(F,V); %Vertex normal vectors
V1=V-N*thicknessOffset/2; %The offset coordinates
V2=V+N*thicknessOffset/2; %The offset coordinates
numVertices=size(V,1);
V=[V1;V2]; %Append new coordinates
F=[F;fliplr(F)+numVertices]; %Append new faces (note offset in indices)
Ebb=[Eb;Eb+numVertices];
Close boundary features
optionStruct.outputType='label';
G=tesgroup(Eb,optionStruct); %grouping of boundary edges

for q=1:1:max(G(:))
    logicGroup=(G==q);
    Eb_now=Eb(logicGroup,:);
    fq=[Eb_now fliplr(Eb_now)+numVertices]; %New quadrilateral faces
    f=[fq(:,[1 2 3]); fq(:,[3 4 1]);]; %New triangular faces
    F=[F;fliplr(f)]; %Append new faces
end

[F,V,~,ind2]=mergeVertices(F,V);
Ebb=ind2(Ebb);

logic1=V(:,3)<(-45/2+0.1);
V(logic1,3)=-45/2;
Visualize thickened surface
cFigure;
hold on; hold on;
title('Thickened  surface','FontSize',fontSize);
gpatch(F,V,'bw','none',1);
gpatch(Ebb,V,'none','b',0,2);
% patchNormPlot(F,V); %Visualize face normal directions
axisGeom;
camlight headlight;
drawnow;
The model can be exported to an STL file using export_STL_txt, see HELP_export_STL_txt.

GIBBON www.gibboncode.org
Kevin Mattheus Moerman, [email protected]
GIBBON footer text
License: https://github.com/gibbonCode/GIBBON/blob/master/LICENSE
GIBBON: The Geometry and Image-based Bioengineering add-On. A toolbox for image segmentation, image-based modeling, meshing, and finite element analysis.
Copyright (C) 2006-2021 Kevin Mattheus Moerman and the GIBBON contributors
This program is free software: you can redistribute it and/or modify it under the terms of the GNU General Public License as published by the Free Software Foundation, either version 3 of the License, or (at your option) any later version.
This program is distributed in the hope that it will be useful, but WITHOUT ANY WARRANTY; without even the implied warranty of MERCHANTABILITY or FITNESS FOR A PARTICULAR PURPOSE. See the GNU General Public License for more details.
You should have received a copy of the GNU General Public License along with this program. If not, see http://www.gnu.org/licenses/.