imx
Below is a demonstration of the features of the imx function
Contents
clear; close all; clc;
Syntax
hf=imx(varargin);
Description
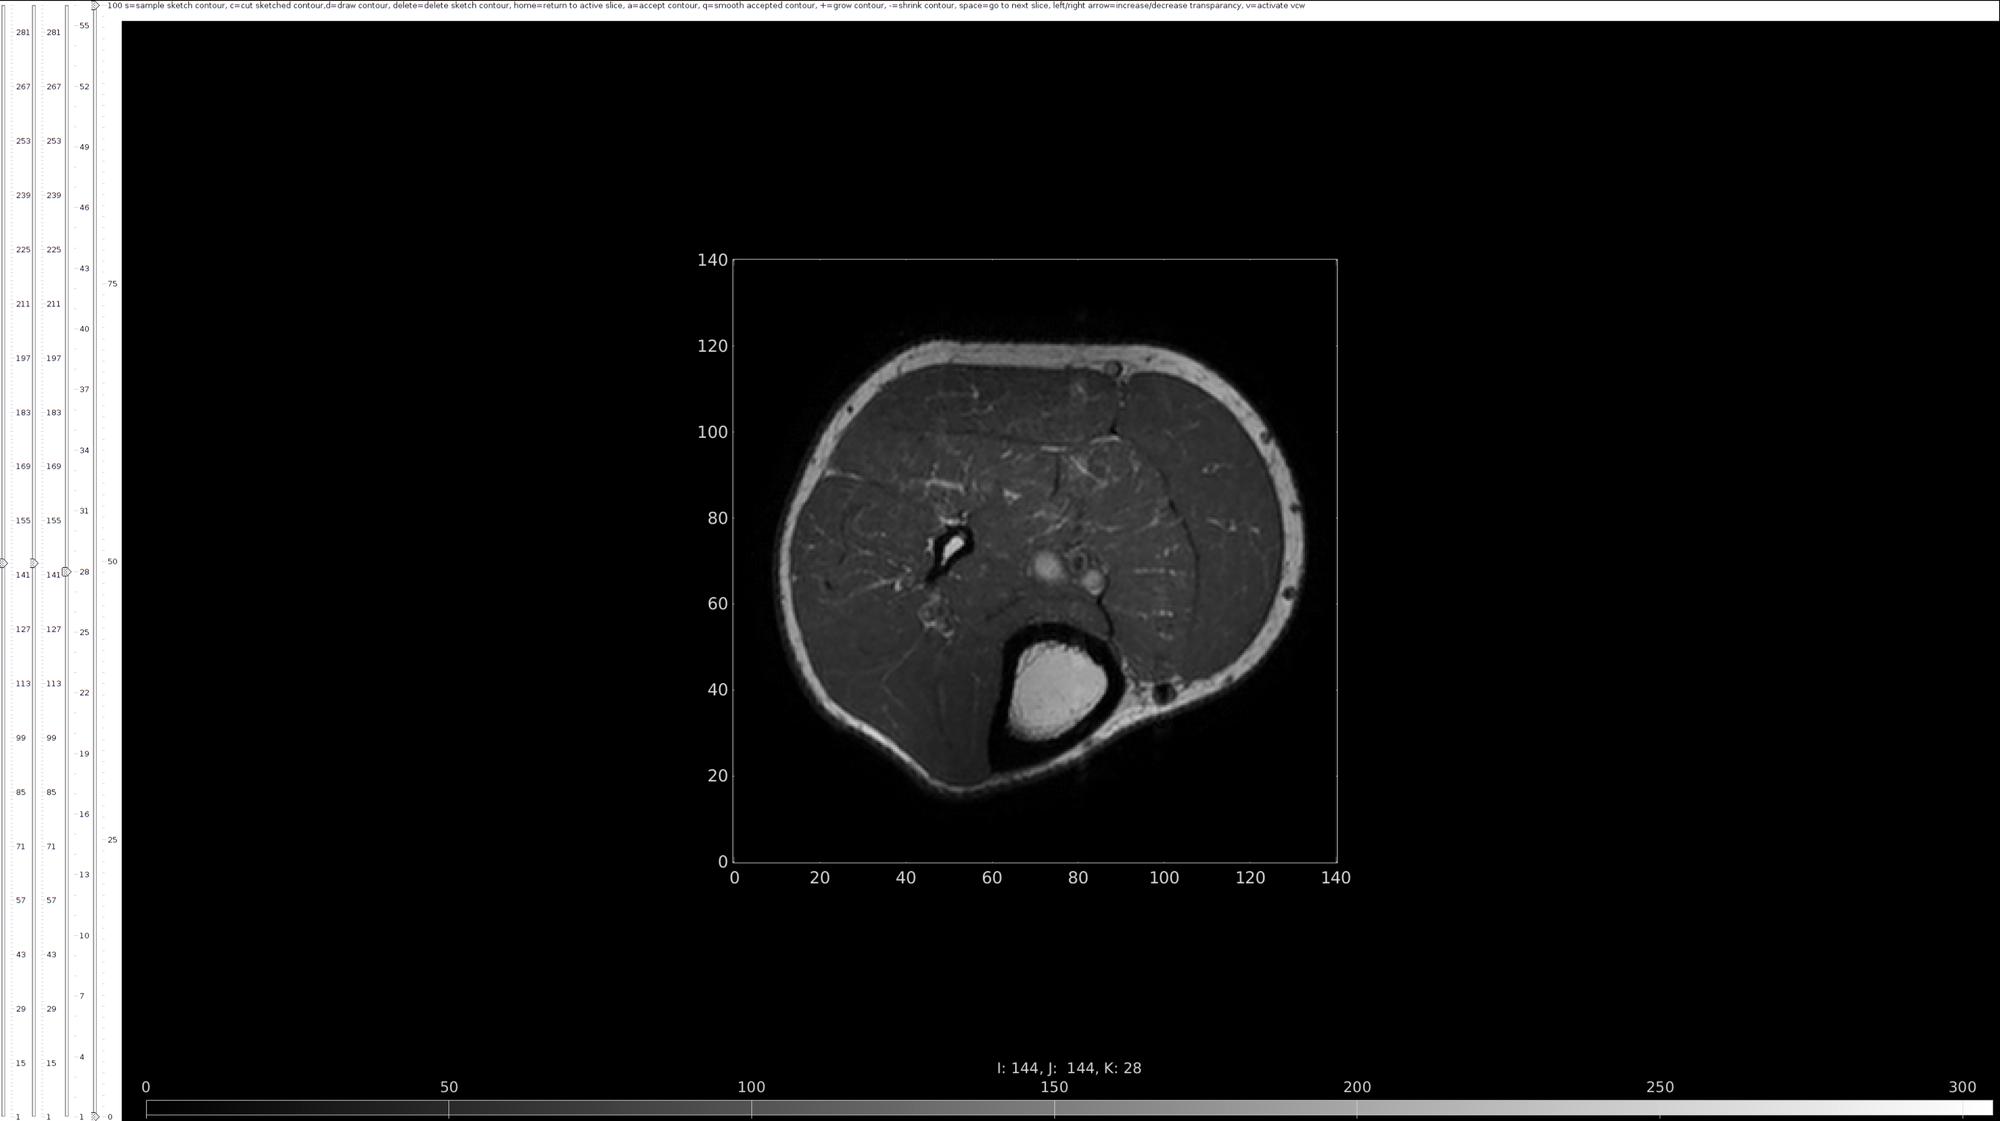
The imx function provides a figure window based GUI for 3D image segmentation
Examples
Example: Segmenting MRI data
Get a 3D image (see also dcmFolder2MATobject to import DICOM data)
testCase=2;
switch testCase
    case 1 %MATLAB brain data
        load mri;
        M=squeeze(D); %example image data set
        v=2./[1,1,.4]; %example voxel size
    case 2 %MRI imported from DICOM files, see also HELP_dcmFolder2MATobject
        defaultFolder = fileparts(fileparts(mfilename('fullpath'))); %Set main folder
        pathName=fullfile(defaultFolder,'data','DICOM','0001_human_calf');
        loadName=fullfile(pathName,'IMDAT','IMDAT.mat');

        IMDAT_struct=load(loadName); %The image data structure
        G = IMDAT_struct.G; %Geometric/spatial information
        v=G.v; %The voxel size
        M= IMDAT_struct.type_1; %The image data
end
Start segmentation using imx
hf=imx(M,v);

Viewing
- Toolbar - Note all functions displayed in the graphical user interface toolbar, equipt with an information panel and descriptions of keyboard shortcuts just below the toolbar. Instructions for each widget will appear along this top bar when in use. Right click to exit from any given widget.
- View manipulation - Use the View Control Widget to zoom, pan, and rotate a figure using different mouse gestures (right mouse button for zoom, left for panning, and middle/scroll for rotating). Use the sliding bars on the left hand side of the graphical user interface to change slice view from all 3 axes. Press home to return to active slice. Use the colorbar button to change the limits of the color axis displayed below the slice, shifting the color contrast across a slice and increasing the visibility of contour lines.

Sketching a contour
- Sample - Begin segmenting an element with s = sample sketch contour. With the activated widget, click on an area of contrast that outlines the element to generate an approximate dotted contour. If the generated outline is unsuitable, click elsewhere along the contrast to produce a new contour. Once the sample contour is acceptable, right click out of the widget. See below for an example of this process in segmenting the skin.

- Cut - Use c = cut sketched contour to edit a sample sketch by boxing and removing an incorrect section of the outline.

- Draw - After cutting a portion of a sample sketch, use the drawing tool to complete the sketch if needed. Use d = draw contour to place connected sketch points along a contour where the path needs to be filled in. After exiting the widget, observe that the drawn sketch will be in a different color compared to the original.

- Adjust - To edit the alignment of certain points along a bad contour, use the adjust tool. To move a sketch point to a new location, click on the point and then click on its new placement.

- Delete - Use the delete tool to erase any sketch contour on the slice.

Accepting a contour
- Select - Once a sketch contour is well fit to an element on the given slice, use a = accept contour to select the contour, changing it to a solid green path. If multiple sketches exist on the slice, select your desired option from the displayed window to either add a new contour, merge with another contour, or replace the existing accepted contours. See below for an example of merging multiple contours of interest.

- Convert - Use the convert button to easily switch from an accepted contour back to a sketch contour if further adjustments are needed. Use the reset button to return to the original, unsegmented slice.

- Grow/Shrink - Use + = grow contour and - = shrink contour to manipulate the size of an accepted contour to best fit a given element. Growing and shrinking contour lines will likely wrinkle the path and require smoothing (see Smooth).

- Smooth - Use q = smooth accepted contour to smoothen a contour path. If more extreme smoothing is necessary, press p while the smoothing tool is activated to adjust the smoothing parameter accordingly.

Finalizing segmentation - After the slice is complete, press space to go to the next slice and continue segmentation for all MRI slices. Periodically check the view of all slices using the showHide tool to verify continuity along the length of an element until completion.


GIBBON www.gibboncode.org
Kevin Mattheus Moerman, [email protected]
GIBBON footer text
License: https://github.com/gibbonCode/GIBBON/blob/master/LICENSE
GIBBON: The Geometry and Image-based Bioengineering add-On. A toolbox for image segmentation, image-based modeling, meshing, and finite element analysis.
Copyright (C) 2019 Kevin Mattheus Moerman
This program is free software: you can redistribute it and/or modify it under the terms of the GNU General Public License as published by the Free Software Foundation, either version 3 of the License, or (at your option) any later version.
This program is distributed in the hope that it will be useful, but WITHOUT ANY WARRANTY; without even the implied warranty of MERCHANTABILITY or FITNESS FOR A PARTICULAR PURPOSE. See the GNU General Public License for more details.
You should have received a copy of the GNU General Public License along with this program. If not, see http://www.gnu.org/licenses/.